OPEN-SOURCE SCRIPT
% Above 50 DMA
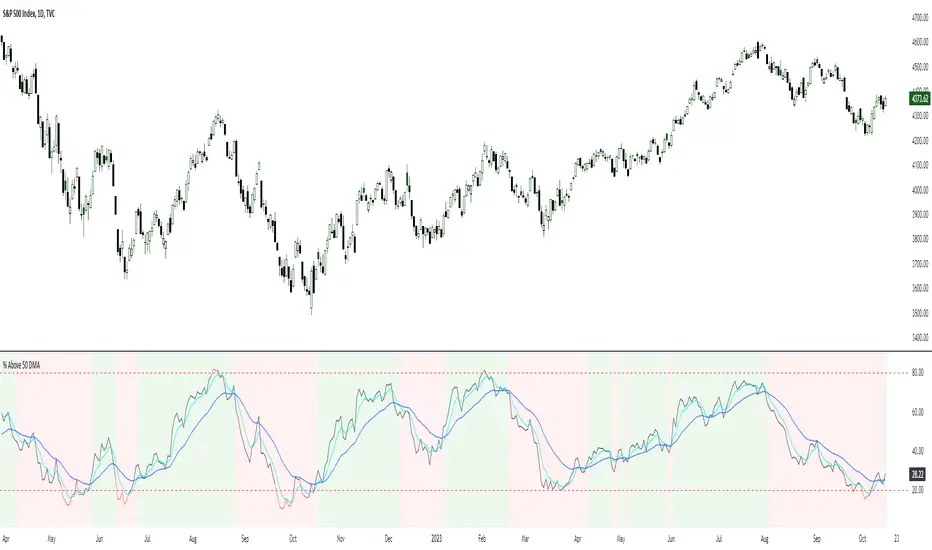
Displays the % of stocks above their 50 day average and the 5 and 20 ema of the indicator. Often the market will trend up when the 5ema is above the 20ema for this indicator, or down when vice versa. The 20% and 80% levels are plotted to show potentially oversold or overbought markets. Select NYSE or Nasdaq in the settings.
Script open-source
Dans l'esprit TradingView, le créateur de ce script l'a rendu open source afin que les traders puissent examiner et vérifier ses fonctionnalités. Bravo à l'auteur! Bien que vous puissiez l'utiliser gratuitement, n'oubliez pas que la republication du code est soumise à nos Règles.
Clause de non-responsabilité
Les informations et publications ne sont pas destinées à être, et ne constituent pas, des conseils ou recommandations financiers, d'investissement, de trading ou autres fournis ou approuvés par TradingView. Pour en savoir plus, consultez les Conditions d'utilisation.