OPEN-SOURCE SCRIPT
ES + NQ vs VIX Risk-On / Risk-Off Toolkit [SB1]
ES + NQ vs VIX Risk-On / Risk-Off Toolkit [SB1] — Indicator Description
This toolkit provides a full market-sentiment dashboard by comparing S&P 500 (ES), Nasdaq 100 (NQ), and VIX behavior in real time. It is designed to quickly identify when conditions align into Risk-On, Risk-Off, or Neutral market states and to highlight high-conviction candles that support trend continuation.
🔹 Core Logic
The script evaluates:
ES & NQ Candle Bias
Each index is classified as Bullish, Bearish, or Neutral based on its current candle (close vs open).
VIX Direction
Rising VIX = Risk-Off pressure
Falling VIX = Risk-On relief
Market Sentiment Alignment
Risk-On: ES Bullish + NQ Bullish + VIX Falling
Risk-Off: ES Bearish + NQ Bearish + VIX Rising
Neutral: Anything not aligned
🔹 Normalized Trend Strength (n-value)
The indicator introduces a normalized trend metric for both ES and NQ:
Uses fast and slow EMAs to measure directional strength
Normalizes the EMA distance by ATR
Produces an n-value that shows trend intensity regardless of volatility regime
Alerts trigger when the trend reaches a configurable strength range
This helps identify when either index is entering a strong trend environment.
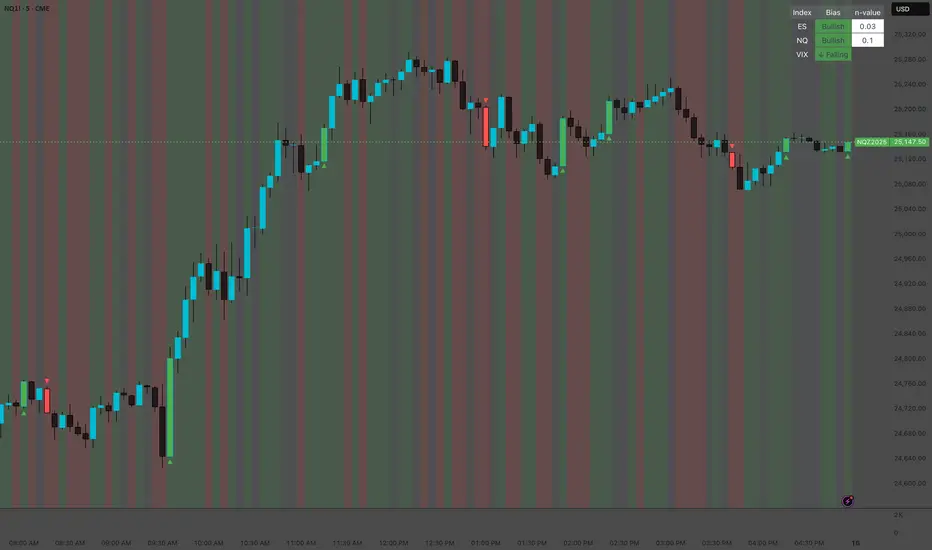
🔹 Movable Dashboard
A clean on-chart dashboard displays:
ES bias & n-value
NQ bias & n-value
VIX direction (Rising / Falling / Flat)
You can place the dashboard in any chart corner (Top-Left, Top-Right, Bottom-Left, Bottom-Right).
🔹 VIX Background Context
Optionally color the chart background automatically:
Green: Risk-On alignment
Red: Risk-Off alignment
Gray: Neutral
This provides immediate visual context behind price action.
🔹 Strong Candle Detection
The script highlights powerful bullish and bearish candles using objective criteria:
Body must exceed a minimum % of the total range
Close must occur near the session extreme
Automatically marks strong candles with up/down triangles
Optionally colors the candle bar for added clarity
Alerts also fire when a strong candle aligns with Risk-On or Risk-Off sentiment.
🔹 Alert System
Built-in alerts cover:
Risk-On alignment
Risk-Off alignment
Neutral/Out-of-alignment context
Strong Bull/Bear Candle + Sentiment alignment
High-trend n-value signals for ES and NQ
All alerts use clear descriptions for automated strategy integration.
📌 Summary
This tool provides a complete multi-asset sentiment engine by combining:
ES & NQ directional bias
VIX volatility pressure
Normalized trend strength
Strong candle confirmation
Visual dashboard
Automated alerts
It is built to support traders who rely on intermarket context, trend strength, and high-confluence entries. Release Notes
🆕 Update: Added Normalized Trend Strength (n-Value)
This update introduces a Normalized Trend Strength metric, displayed as a small numeric value next to each trend signal. It measures how strong the current trend is relative to market volatility.
How It Works
The n-value uses the difference between the Fast EMA and Slow EMA, divided by ATR:
n = | Fast EMA – Slow EMA | ÷ ATR
This transforms raw price movement into a volatility-adjusted trend strength score, making it easier to compare trend quality across different market conditions.
How to Read the n-Value
n-Value Meaning
< 0.10 No trend / Chop / Noise
0.10 – 0.30 Weak trend
0.30 – 0.60 Moderate trend
0.60 – 1.00 Strong trend
1.00+ Very strong momentum
Why It Matters
This addition helps you:
Filter weak signals
Confirm when a trend has real strength
Avoid low-quality setups
Spot strong momentum early
The n-value works automatically with your existing Fast/Slow EMA trend logic and appears inline with the trend label so you can evaluate signals at a glance.
This toolkit provides a full market-sentiment dashboard by comparing S&P 500 (ES), Nasdaq 100 (NQ), and VIX behavior in real time. It is designed to quickly identify when conditions align into Risk-On, Risk-Off, or Neutral market states and to highlight high-conviction candles that support trend continuation.
🔹 Core Logic
The script evaluates:
ES & NQ Candle Bias
Each index is classified as Bullish, Bearish, or Neutral based on its current candle (close vs open).
VIX Direction
Rising VIX = Risk-Off pressure
Falling VIX = Risk-On relief
Market Sentiment Alignment
Risk-On: ES Bullish + NQ Bullish + VIX Falling
Risk-Off: ES Bearish + NQ Bearish + VIX Rising
Neutral: Anything not aligned
🔹 Normalized Trend Strength (n-value)
The indicator introduces a normalized trend metric for both ES and NQ:
Uses fast and slow EMAs to measure directional strength
Normalizes the EMA distance by ATR
Produces an n-value that shows trend intensity regardless of volatility regime
Alerts trigger when the trend reaches a configurable strength range
This helps identify when either index is entering a strong trend environment.
🔹 Movable Dashboard
A clean on-chart dashboard displays:
ES bias & n-value
NQ bias & n-value
VIX direction (Rising / Falling / Flat)
You can place the dashboard in any chart corner (Top-Left, Top-Right, Bottom-Left, Bottom-Right).
🔹 VIX Background Context
Optionally color the chart background automatically:
Green: Risk-On alignment
Red: Risk-Off alignment
Gray: Neutral
This provides immediate visual context behind price action.
🔹 Strong Candle Detection
The script highlights powerful bullish and bearish candles using objective criteria:
Body must exceed a minimum % of the total range
Close must occur near the session extreme
Automatically marks strong candles with up/down triangles
Optionally colors the candle bar for added clarity
Alerts also fire when a strong candle aligns with Risk-On or Risk-Off sentiment.
🔹 Alert System
Built-in alerts cover:
Risk-On alignment
Risk-Off alignment
Neutral/Out-of-alignment context
Strong Bull/Bear Candle + Sentiment alignment
High-trend n-value signals for ES and NQ
All alerts use clear descriptions for automated strategy integration.
📌 Summary
This tool provides a complete multi-asset sentiment engine by combining:
ES & NQ directional bias
VIX volatility pressure
Normalized trend strength
Strong candle confirmation
Visual dashboard
Automated alerts
It is built to support traders who rely on intermarket context, trend strength, and high-confluence entries. Release Notes
🆕 Update: Added Normalized Trend Strength (n-Value)
This update introduces a Normalized Trend Strength metric, displayed as a small numeric value next to each trend signal. It measures how strong the current trend is relative to market volatility.
How It Works
The n-value uses the difference between the Fast EMA and Slow EMA, divided by ATR:
n = | Fast EMA – Slow EMA | ÷ ATR
This transforms raw price movement into a volatility-adjusted trend strength score, making it easier to compare trend quality across different market conditions.
How to Read the n-Value
n-Value Meaning
< 0.10 No trend / Chop / Noise
0.10 – 0.30 Weak trend
0.30 – 0.60 Moderate trend
0.60 – 1.00 Strong trend
1.00+ Very strong momentum
Why It Matters
This addition helps you:
Filter weak signals
Confirm when a trend has real strength
Avoid low-quality setups
Spot strong momentum early
The n-value works automatically with your existing Fast/Slow EMA trend logic and appears inline with the trend label so you can evaluate signals at a glance.
Script open-source
Dans l'esprit TradingView, le créateur de ce script l'a rendu open source afin que les traders puissent examiner et vérifier ses fonctionnalités. Bravo à l'auteur! Bien que vous puissiez l'utiliser gratuitement, n'oubliez pas que la republication du code est soumise à nos Règles.
Clause de non-responsabilité
Les informations et publications ne sont pas destinées à être, et ne constituent pas, des conseils ou recommandations financiers, d'investissement, de trading ou autres fournis ou approuvés par TradingView. Pour en savoir plus, consultez les Conditions d'utilisation.