OPEN-SOURCE SCRIPT
TradingCharts SCTR [Bginvestor]
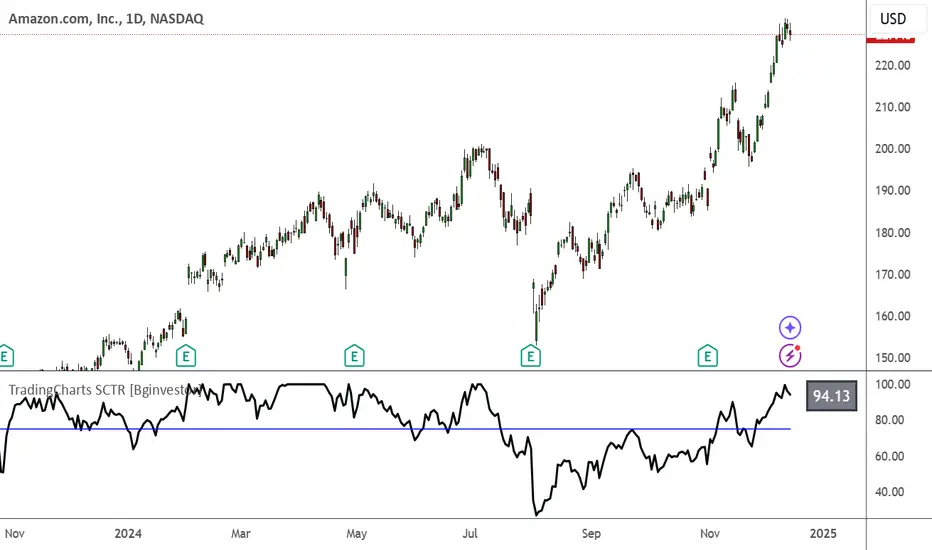
This indicator is replicating Tradingcharts, SCTR plot. If you know, you know.
Brief description: The StockCharts Technical Rank (SCTR), conceived by technical analyst John Murphy, emerges as a pivotal tool in evaluating a stock’s technical prowess. This numerical system, colloquially known as “scooter,” gauges a stock’s strength within various groups, employing six key technical indicators across different time frames.
How to use it:
Long-term indicators (30% weight each)
-Percent above/below the 200-day exponential moving average (EMA)
-125-day rate-of-change (ROC)
Medium-term indicators (15% weight each)
-percent above/below 50-day EMA
-20-day rate-of-change
Short-term indicators (5% weight each)
-Three-day slope of percentage price oscillator histogram divided by three
-Relative strength index
How to use SCTR:
Investors select a specific group for analysis, and the SCTR assigns rankings within that group. A score of 99.99 denotes robust technical performance, while zero signals pronounced underperformance. Traders leverage this data for strategic decision-making, identifying stocks with increasing SCTR for potential buying or spotting weak stocks for potential shorting.
Credit: I've made some modifications, but credit goes to GodziBear for back engineering the averaging / scaling of the equations.
Note: Not a perfect match to TradingCharts, but very, very close.
Script open-source
Dans l'esprit TradingView, le créateur de ce script l'a rendu open source afin que les traders puissent examiner et vérifier ses fonctionnalités. Bravo à l'auteur! Bien que vous puissiez l'utiliser gratuitement, n'oubliez pas que la republication du code est soumise à nos Règles.
Clause de non-responsabilité
Les informations et publications ne sont pas destinées à être, et ne constituent pas, des conseils ou recommandations financiers, d'investissement, de trading ou autres fournis ou approuvés par TradingView. Pour en savoir plus, consultez les Conditions d'utilisation.