INVITE-ONLY SCRIPT
Market Navigator
Mis à jour
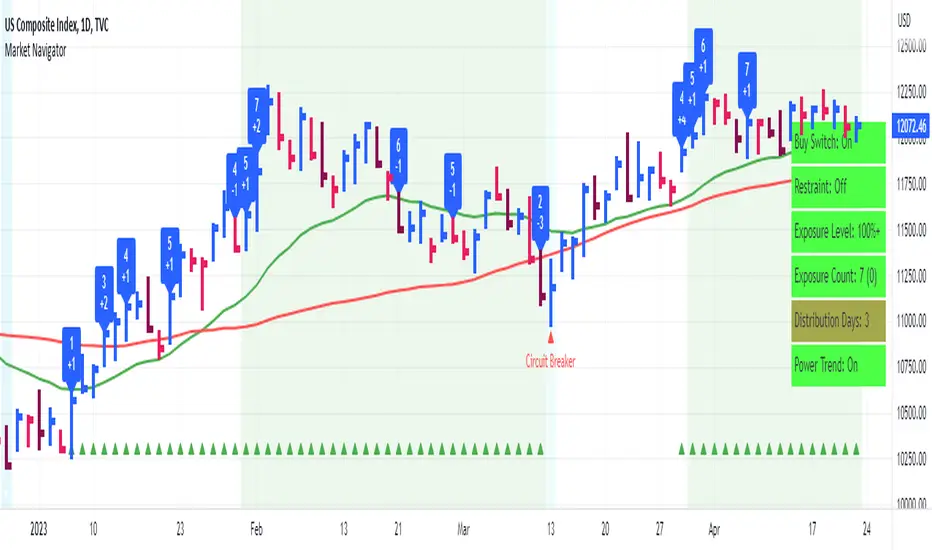
The Market Navigator turns the methodology taught in Market School by Investors Business Daily into an easy-to-use indicator. This system follows a strict set of rules to help gauge when it's time to increase market exposure or back away.
The indicator considers 24 different buy and sell signals, as well as portfolio management rules, to keep you on the right side of the market with no guesswork.
Buy and sell signals are generated based on different criteria, including the relationship between price and key moving averages, volume, and time. Each signal is assigned a point value, which is then added (buy signal) or subtracted (sell signal) to the running exposure count when the signal occurs. This exposure count is then used to give a recommended maximum exposure level.
The Market Navigator also identifies certain instances when being more aggressive is called for, known as a Power Trend. A Power Trend is triggered within the context of an uptrend that meets a certain criterion of price, length, and moving average relationship.
This indicator is a must-have for any trader looking to take the guesswork out of their trading by automating recommended exposure levels and being in step with the market
Principles covered include:
Customize the indicator so it fits and looks great on your charts!
Dynamic Day 1
When you first put the indicator on your chart, it will ask you to select Day 1 of the current rally attempt. A Day 1 is defined as either:

With over 24 buy and sell signals, the built-in reference table makes it simple to crosscheck which signals occur.

Included with this indicator is access to the Market Navigator Oscillator, which plots the exposure count as a line in a separate pane, keeping your main chart uncluttered. This version allows you to see all of the same information in a condensed form.

Disclaimer: This indicator is for informational and educational purposes only. Do your own research before making any trade decisions. I accept no liability for any loss or damage, including without limitation any loss of profit, which may arise directly or indirectly from use of or reliance on this indicator.
I am not affiliated with Investor's Business Daily. This is my original interpretation of the rules taught in the Market School Home Study Program.
The indicator considers 24 different buy and sell signals, as well as portfolio management rules, to keep you on the right side of the market with no guesswork.
Buy and sell signals are generated based on different criteria, including the relationship between price and key moving averages, volume, and time. Each signal is assigned a point value, which is then added (buy signal) or subtracted (sell signal) to the running exposure count when the signal occurs. This exposure count is then used to give a recommended maximum exposure level.
The Market Navigator also identifies certain instances when being more aggressive is called for, known as a Power Trend. A Power Trend is triggered within the context of an uptrend that meets a certain criterion of price, length, and moving average relationship.
This indicator is a must-have for any trader looking to take the guesswork out of their trading by automating recommended exposure levels and being in step with the market
Principles covered include:
- Recommended maximum portfolio exposure
- Buy switch / restraint rules
- Follow through / distribution days
- Power Trend
Customize the indicator so it fits and looks great on your charts!
- Multiple ways to view key information
- Customize colors
- Show or hide different element to see as much or as little information as you want
- Highlight the background of Power Trends
- Change the bar color of distribution/stall days
- Change table position & size
- Show or hide key moving averages
Dynamic Day 1
When you first put the indicator on your chart, it will ask you to select Day 1 of the current rally attempt. A Day 1 is defined as either:
- The first positive day in a down trending market
- A down day where the index closes in the upper half of the daily range
With over 24 buy and sell signals, the built-in reference table makes it simple to crosscheck which signals occur.
Included with this indicator is access to the Market Navigator Oscillator, which plots the exposure count as a line in a separate pane, keeping your main chart uncluttered. This version allows you to see all of the same information in a condensed form.
Disclaimer: This indicator is for informational and educational purposes only. Do your own research before making any trade decisions. I accept no liability for any loss or damage, including without limitation any loss of profit, which may arise directly or indirectly from use of or reliance on this indicator.
I am not affiliated with Investor's Business Daily. This is my original interpretation of the rules taught in the Market School Home Study Program.
Notes de version
Update instructions for a week trialNotes de version
Small update to reset swing high price for circuit breaker after the buy switch turns offNotes de version
Added the option to show small arrows up or down to signify a change in the exposure count, rather than just the exposure count labels.Allows for a more unobstructed view of price action.
Notes de version
Update to stall day calculations. Closing range for a stall day now needs to be less than 33% instead of 25%.Notes de version
Minor update to fix a bug caused by the latest update. Notes de version
Small update to fix the resetting of swing high prices following a circuit breakerNotes de version
Update to show when the Power Trend is Under Pressure (U.P.) in the data table. Also update to the S9 logic. Notes de version
Minor Update. Please update to this newest version to make sure readings are accurate. Notes de version
Added ability to see labels for all signals regardless of if the exposure count changes. This can be turned on or off in the settings by selecting "Show All Signal".Notes de version
Added ability for volatility adjusted follow through days. The reference table will now also display the current volatility and % gain needed for a volatility adjusted follow through day based on the parameters below. - Volatility defined as the average percentage gain of the up days over the prior 200 days.
- Volatility less than or equal to 0.4%, follow-through must close up 0.7% or higher.
- Volatility greater than or equal to 0.4% and less than 0.55%, follow-through must close up 0.85% or higher.
- Volatility greater than or equal to 0.55% and less than 1.00%, follow-through must close up 1.00% or higher.
- Volatility greater than or equal to 1.00%, follow-through must close up 1.245% or higher.
Notes de version
Update to restraint rule logicNotes de version
Minor update to sell signals.Notes de version
Updated volume source for the indexes, should update in real time now. Notes de version
Small update to fix a bug in the data table displaying the number of stall days when the buy switch was off.Notes de version
The Market Navigator now includes the option to turn on or off the 95% rule.The 95% rule was not talked about in the original Market School course but was later added as a rule for stall days. With the rule turned on, when stalling action occurs and volume is within 95% of the previous days volume, it will be counted as a stall day.
If the 95% rule is turned off, higher volume than the previous day will be required for stall days.
Notes de version
Small fix to Power Trend when using it on individual stocks instead of indexes. Notes de version
Update to Power Trend under pressure from a distribution cluster and living above the 21 logic Notes de version
Allowing for more distribution days to show in the data table counter. Notes de version
updates to low above 21 ema countNotes de version
Update for power trend under pressureNotes de version
50 day break updateNotes de version
bug fix on overdue break of 21emaNotes de version
D Day Fall off bug fixScript sur invitation seulement
L'accès à ce script est limité aux utilisateurs autorisés par l'auteur et nécessite généralement un paiement. Vous pouvez l'ajouter à vos favoris, mais vous ne pourrez l'utiliser qu'après avoir demandé et obtenu l'autorisation de son auteur. Contactez Amphibiantrading pour plus d'informations, ou suivez les instructions de l'auteur ci-dessous.
TradingView ne suggère pas de payer pour un script et de l'utiliser à moins que vous ne fassiez confiance à 100% à son auteur et que vous compreniez comment le script fonctionne. Dans de nombreux cas, vous pouvez trouver une bonne alternative open-source gratuite dans nos Scripts communautaires.
Instructions de l'auteur
″This indicator is available for purchase here: https://bit.ly/3oAd3gF --------
For a week trial please send me a direct message
Vous voulez utiliser ce script sur un graphique ?
Avertissement: veuillez lire avant de demander l'accès.
Trusted Pine programmer. Send me a message for script development.
Clause de non-responsabilité
Les informations et les publications ne sont pas destinées à être, et ne constituent pas, des conseils ou des recommandations en matière de finance, d'investissement, de trading ou d'autres types de conseils fournis ou approuvés par TradingView. Pour en savoir plus, consultez les Conditions d'utilisation.