PROTECTED SOURCE SCRIPT
Mis à jour 4H-50/50 Method
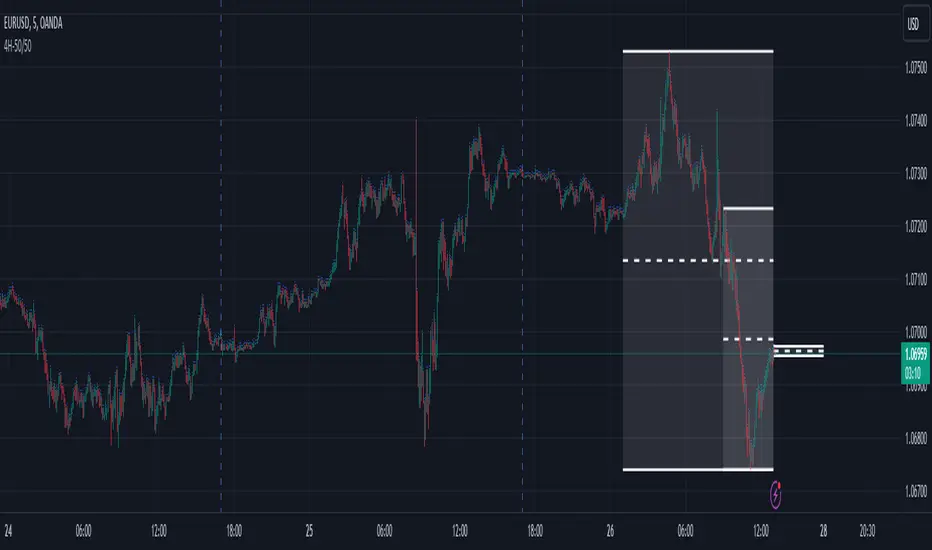
4H-50/50 tool is a way to visualize top down analysis.
• There are three boxes illustrated on the chart
- One box shows the past 4 hour time frame's high, low and center
- One box shows the past 12 hour time frame's high, low and center
- The last box is the current 4 hour time frame's high, low and center
• Four hour blocks start on specific hours 1, 5, 9, 13, 17 & 21
• The 50% marks can act as resistance/support
• The 50% marks can also show trend
- If the instrument is trading below all 50% lines, this is one indication that price will remain low or go lower.
- If the instrument is trading above all 50% lines, this is one indication that price will remain high or go higher
• The indicator can also show sentiment values, which can be found on several outside websites
- After entering both the long and short sentiment, a 10 pip bumper will appear around these sentiment numbers giving another form of support/resistance to watch for
Current limitations:
• The four hour blocks currently only work on the 5 minute candle timeframe
• The sentiment bumper size and color are fixed
Bugs?
Kindly report any issues you run into and I'll try to fix them promptly.
Thank you!
Notes de version
4H-50/50 tool is a way to visualize top down analysis.• There are three boxes illustrated on the chart
- One box shows the past 4 hour time frame's high, low and center
- One box shows the past 12 hour time frame's high, low and center
- The last box is the current 4 hour time frame's high, low and center
• Four hour blocks start on specific hours 1, 5, 9, 13, 17 & 21
• The 50% marks can act as resistance/support
• The 50% marks can also show trend
- If the instrument is trading below all 50% lines, this is one indication that price will remain low or go lower.
- If the instrument is trading above all 50% lines, this is one indication that price will remain high or go higher
• The indicator can also show sentiment values, which can be found on several outside websites
- After entering both the long and short sentiment, a 10 pip bumper will appear around these sentiment numbers giving another form of support/resistance to watch for
Current limitations:
• The four hour blocks currently only work on the 5 minute candle timeframe
• The sentiment bumper size and color are fixed
Bugs?
Kindly report any issues you run into and I'll try to fix them promptly.
Thank you!
Script protégé
Ce script est publié en source fermée. Cependant, vous pouvez l'utiliser librement et sans aucune restriction – pour en savoir plus, cliquez ici.
Clause de non-responsabilité
Les informations et publications ne sont pas destinées à être, et ne constituent pas, des conseils ou recommandations financiers, d'investissement, de trading ou autres fournis ou approuvés par TradingView. Pour en savoir plus, consultez les Conditions d'utilisation.