OPEN-SOURCE SCRIPT
Mis à jour MA and Channel overlay
Some overlay utilities:
- Draw 3 moving averages (MA) with circles line.
- Option to choose type of MA to plot.
- Draw start point of those MA with a big cross.
- Option to draw channel: Donchian, Bollinger and Envelope.
- Option to draw stop loss line: ATR or Percentage.
- Draw background color in monthly, weekly, daily, intraday, ... chart (remember to choose your correct timezone if using intraday chart).
- Draw a label of last price.
- Draw next prices.
Notes de version
Added comments and showed stop loss line for demo purpose.Notes de version
Option to show / hide MAs.Notes de version
New chart view.Notes de version
Add intraday labels which show day number in month and weekday name.Notes de version
Add hour range to draw sleep time in intraday chart.Notes de version
Fixed time zone issue for exchange that has non-UTC timezone.Notes de version
Fix weekly background issue.Notes de version
Fix channel len issue.Notes de version
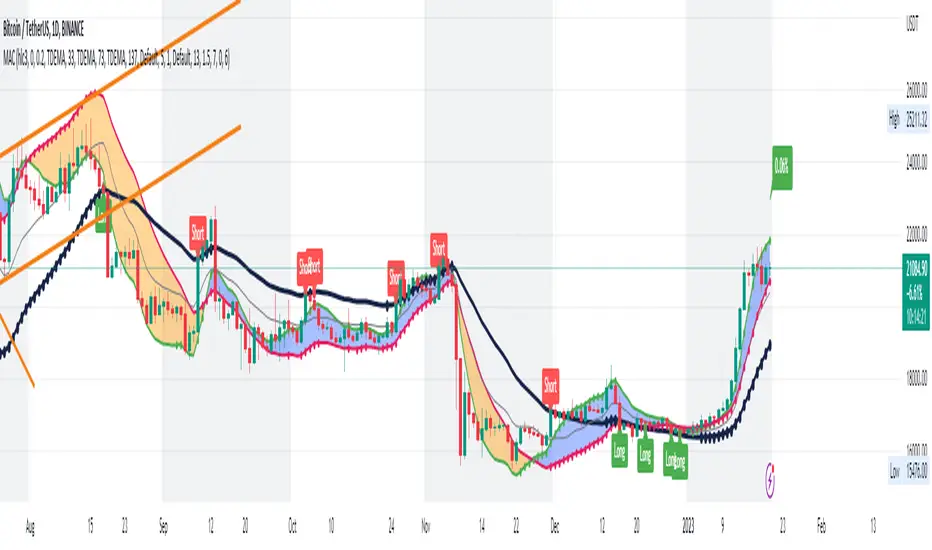
- Use TDEMA as the default MA now.- Use bigger periods to catch trend easier.
- Drawed a band between small and medium period (MA1 and MA2) lines.
- The position of this band and the big period line (MA3) is the key to check the trend now.
Script open-source
Dans l'esprit TradingView, le créateur de ce script l'a rendu open source afin que les traders puissent examiner et vérifier ses fonctionnalités. Bravo à l'auteur! Bien que vous puissiez l'utiliser gratuitement, n'oubliez pas que la republication du code est soumise à nos Règles.
Clause de non-responsabilité
Les informations et publications ne sont pas destinées à être, et ne constituent pas, des conseils ou recommandations financiers, d'investissement, de trading ou autres fournis ou approuvés par TradingView. Pour en savoir plus, consultez les Conditions d'utilisation.