INVITE-ONLY SCRIPT
Oscillator pack [Tcs] | OSC
These oscillators are a reinterpretation of some of the most famous indicators for traders, with the scope to provide higher accuracy and better readability.
The improvements are based on both calculation and visual impact, with calculations incorporating not only price but also tick volume to enhance signal accuracy.
All oscillators can be applied to different timeframes than the chart being analyzed.
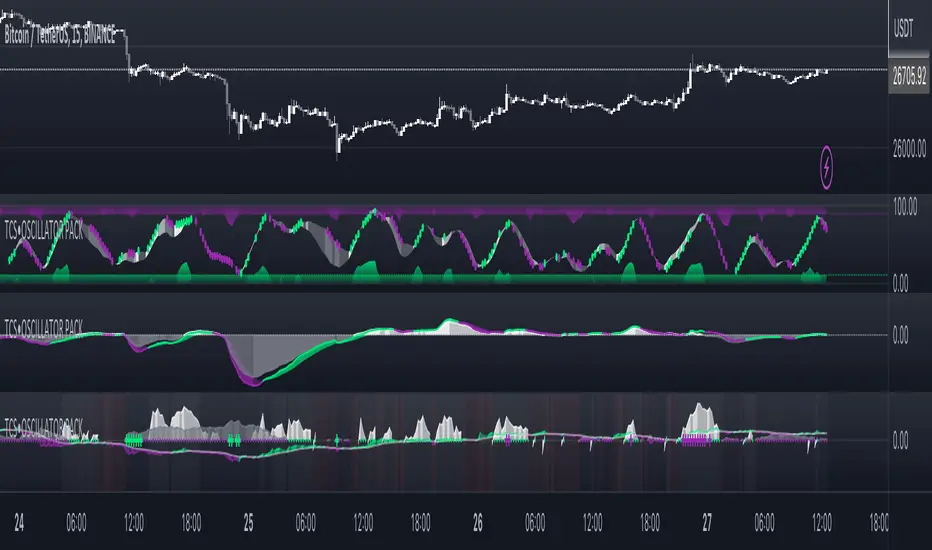
This indicator includes three different oscillators: TCS Stochastic, TCS MACD, and TCS Momentum.
•TCS STOCHASTIC
The TCS STOCHASTIC removes the noise from the standard RSI Stochastic and significantly reduces the number of anticipated signals (line crosses) that the RSI Stochastic provides. Similarly, the divergences are less frequent but more accurate.
The indicator plots overbought conditions (plotted as green waves) and oversold conditions (plotted as purple waves) in a clear way.
The Stochastic channel marks the power of buyers or sellers with white (bullish) and gray (bearish) shades.
The dots on the Stochastic line indicate when buyers or sellers are in control. This helps both in trend following conditions and reversal points.
The tinier the channel, defined by the Stochastic line and signal line, the stronger the trend is likely to be.

•TCS MACD
The TCS MACD removes noise from the standard MACD and often anticipates good entry points for standard MACD crosses, while delaying bad ones.
Additionally, the indicator's performance for divergences has been improved, as it takes into account both price action and on balance volume.
It has also been developed to provide better performance at the 0 line level, which can be a good entry point when the baseline is crossed.
The histogram helps to identify divergences and the strength of the trend.

•TCS MOMENTUM
The TCS MOMENTUM WAVES indicate the trend direction based on the strength of momentum and moments of accumulation/distribution, which are highlighted with a red background.
Bullish trends are represented with white waves, while bearish trends are shown in gray.
Crosses symbol on the 0 line indicate a possible trend reversal, with green for bullish and purple for bearish.
The best entry point for a reversal is when the momentum line changes to the trend direction color after a reversal point is detected.
The momentum line and its signal line can also be used to identify entry points for a strategy, as well as the crosses of the waves.

Please note that this indicator is for educational purposes only and should not be used for trading without further testing and analysis.
The improvements are based on both calculation and visual impact, with calculations incorporating not only price but also tick volume to enhance signal accuracy.
All oscillators can be applied to different timeframes than the chart being analyzed.
This indicator includes three different oscillators: TCS Stochastic, TCS MACD, and TCS Momentum.
•TCS STOCHASTIC
The TCS STOCHASTIC removes the noise from the standard RSI Stochastic and significantly reduces the number of anticipated signals (line crosses) that the RSI Stochastic provides. Similarly, the divergences are less frequent but more accurate.
The indicator plots overbought conditions (plotted as green waves) and oversold conditions (plotted as purple waves) in a clear way.
The Stochastic channel marks the power of buyers or sellers with white (bullish) and gray (bearish) shades.
The dots on the Stochastic line indicate when buyers or sellers are in control. This helps both in trend following conditions and reversal points.
The tinier the channel, defined by the Stochastic line and signal line, the stronger the trend is likely to be.
•TCS MACD
The TCS MACD removes noise from the standard MACD and often anticipates good entry points for standard MACD crosses, while delaying bad ones.
Additionally, the indicator's performance for divergences has been improved, as it takes into account both price action and on balance volume.
It has also been developed to provide better performance at the 0 line level, which can be a good entry point when the baseline is crossed.
The histogram helps to identify divergences and the strength of the trend.
•TCS MOMENTUM
The TCS MOMENTUM WAVES indicate the trend direction based on the strength of momentum and moments of accumulation/distribution, which are highlighted with a red background.
Bullish trends are represented with white waves, while bearish trends are shown in gray.
Crosses symbol on the 0 line indicate a possible trend reversal, with green for bullish and purple for bearish.
The best entry point for a reversal is when the momentum line changes to the trend direction color after a reversal point is detected.
The momentum line and its signal line can also be used to identify entry points for a strategy, as well as the crosses of the waves.
Please note that this indicator is for educational purposes only and should not be used for trading without further testing and analysis.
Script sur invitation seulement
L'accès à ce script est limité aux utilisateurs autorisés par l'auteur et nécessite généralement un paiement. Vous pouvez l'ajouter à vos favoris, mais vous ne pourrez l'utiliser qu'après avoir demandé et obtenu l'autorisation de son auteur. Contactez zendrer pour plus d'informations, ou suivez les instructions de l'auteur ci-dessous.
TradingView ne suggère pas de payer pour un script et de l'utiliser à moins que vous ne fassiez confiance à 100% à son auteur et que vous compreniez comment le script fonctionne. Dans de nombreux cas, vous pouvez trouver une bonne alternative open-source gratuite dans nos Scripts communautaires.
Instructions de l'auteur
″You can find all the necessary info in the website http://www.thecryptostrategist.com
Vous voulez utiliser ce script sur un graphique ?
Avertissement: veuillez lire avant de demander l'accès.
For the access to premium indicators please contact me on tradingview
Clause de non-responsabilité
Les informations et les publications ne sont pas destinées à être, et ne constituent pas, des conseils ou des recommandations en matière de finance, d'investissement, de trading ou d'autres types de conseils fournis ou approuvés par TradingView. Pour en savoir plus, consultez les Conditions d'utilisation.