OPEN-SOURCE SCRIPT
Volatility Channel Oscillator
█ OVERVIEW
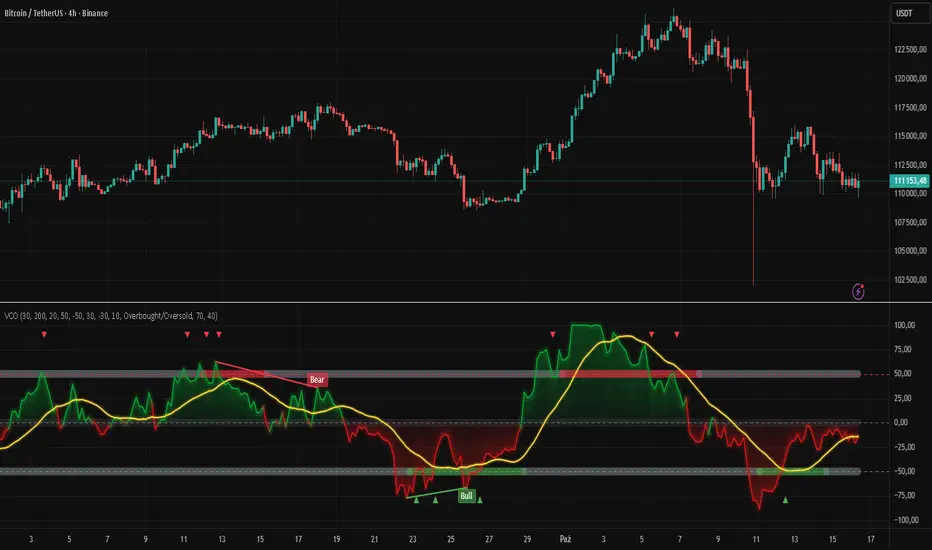
"Volatility Channel Oscillator" is a technical indicator that analyzes price volatility relative to dynamic price channels, displaying an oscillator, its moving average, and signals based on crossovers and divergences. The indicator offers customizable overbought and oversold levels, gradient visualization, and divergence detection, supported by alerts for key signals.
█ CONCEPTS
The VCO indicator creates dynamic price channels based on a moving average of the price (calculated as the arithmetic mean of the high and low prices: (high + low) / 2) and market volatility (measured as the average candle range and body size). These channels are not displayed on the chart but are used to calculate the oscillator value, which reflects the position of the closing price relative to the channel width, scaled to a range from -100 to +100, with the zero line as the central point. A moving average of the oscillator (SMA) smooths its values, enabling signals based on crossovers with the zero line or overbought/oversold levels. The indicator also detects divergences between price and the oscillator, which may indicate potential trend reversals. VCO is useful for identifying market momentum, reversal points, and trend confirmation, especially when combined with other technical analysis tools.
█ FEATURES
- Volatility Channels: Calculates invisible chart boundaries based on a simple moving average (SMA) of the price (high + low) / 2 and volatility (average candle range and body). The length parameter (default 30) sets the SMA length, and scale (default 200%) adjusts the channel width.
- Oscillator: Determines the oscillator value in the range of -100 to +100, indicating the closing price's position relative to the volatility channel. Displayed with dynamic coloring (green for positive values, red for negative).
- Oscillator Moving Average: A simple moving average (SMA) of the oscillator values, smoothing its movements. The signalLength parameter (default 20) defines the SMA length. Displayed in yellow with an optional gradient.
- Overbought/Oversold Levels: Configurable thresholds for the oscillator (overbought, default 50; oversold, default -50) and its moving average (maOverbought, default 30; maOversold, default -30), shown as horizontal lines with optional gradients. Band colors change dynamically (red for overbought, green for oversold, gray for neutral) based on the moving average's position relative to maOverbought/maOversold, reinforcing other signals.
- Divergences: Detects bullish (price forms a lower low, oscillator a higher low) and bearish (price forms a higher high, oscillator a lower high) divergences using pivots (pivotLength, default 2). Divergences are displayed with a delay equal to the pivot length; larger lengths increase reliability but delay signals. Use as additional confirmation.
Signals:
- Overbought/Oversold Crossovers: Green triangles (buy) when the oscillator crosses above the oversold level, red triangles (sell) when it crosses below the overbought level.
- Zero Line Crossovers: Buy/sell signals when the oscillator crosses the zero line upward (buy) or downward (sell).
- Moving Average Crossovers: Buy/sell signals when the oscillator's moving average crosses the zero line or the maOverbought/maOversold levels. Dynamic band color changes (red/green) at these crossovers reinforce other signals.
- Visualization: Gradient lines for the oscillator, its moving average, overbought/oversold levels, and zero line, with adjustable transparency. Gradient fill between the oscillator and zero line.
Divergence Labels: "Bull" (bullish) and "Bear" (bearish) labels with customizable color and transparency.
- Alerts: Built-in alerts for divergences, overbought/oversold crossovers, and zero line crossovers by the oscillator and its moving average.
█ HOW TO USE
Add to Chart: Apply the indicator via Pine Editor or the Indicators menu on TradingView.
Configure Settings:
- Channel and Oscillator Settings: Adjust the channel SMA length (length, default 30) and channel scaling (scale, default 200%). Increase scale for high-volatility markets.
- Threshold Levels: Set oscillator overbought (overbought, default 50) and oversold (oversold, default -50) levels, and moving average thresholds (maOverbought, default 30; maOversold, default -30).
- Divergence Settings: Enable/disable divergence detection (calculateDivergence) and set pivot length (pivotLength, default 2). Larger values increase reliability but delay signals.
- Signal Settings: Choose signal types (signalType): overbought/oversold, zero line, moving average, or all.
- Styling: Customize colors for the oscillator, moving average, horizontal levels, and divergence labels. Adjust gradient and fill transparency.
Interpreting Signals:
- Buy Signals: Green triangles below the bar when the oscillator or its moving average crosses above the oversold level or zero line.
- Sell Signals: Red triangles above the bar when the oscillator or its moving average crosses below the overbought level or zero line.
- Moving Average Signals: Green/red triangles when the moving average crosses maOverbought/maOversold levels, indicating potential reversals or trend continuation. Dynamic band color changes (red for overbought, green for oversold) at these crossovers reinforce other signals.
- Divergences: "Bull" (bullish) and "Bear" (bearish) labels indicate potential trend reversals with a delay based on pivot length. Use as confirmation.
- Overbought/Oversold Levels: Monitor price reactions in these zones as potential reversal points. Dynamic band color changes based on the moving average reinforce signals.
Signal Confirmation: Use VCO with other tools, such as pivot levels (for key turning points) or Fibonacci levels (for support/resistance zones).
█ APPLICATIONS
- Trend Trading: Zero line crossovers by the oscillator or its moving average identify momentum in uptrends or downtrends.
- Range Trading: Overbought/oversold levels help identify entry/exit points in sideways markets.
- Divergences: Use bullish/bearish divergences as additional confirmation of reversals, especially near key price levels.
- Trend Identification: To analyze trends over a longer perspective, increase the moving average length (signalLength) for more stable signals.
█ NOTES
- Test the indicator across different timeframes and markets to optimize parameters, such as length and scale, for your trading style.
- In strong trends, overbought/oversold levels may persist, requiring additional signal verification.
- Divergences are more reliable on higher timeframes (H4, D1), where market noise is reduced, but their delay requires caution.
- In low-liquidity markets, signals may be less effective, so use on high-liquidity assets is recommended.
Script open-source
Dans l'esprit TradingView, le créateur de ce script l'a rendu open source afin que les traders puissent examiner et vérifier ses fonctionnalités. Bravo à l'auteur! Bien que vous puissiez l'utiliser gratuitement, n'oubliez pas que la republication du code est soumise à nos Règles.
Clause de non-responsabilité
Les informations et publications ne sont pas destinées à être, et ne constituent pas, des conseils ou recommandations financiers, d'investissement, de trading ou autres fournis ou approuvés par TradingView. Pour en savoir plus, consultez les Conditions d'utilisation.