OPEN-SOURCE SCRIPT
Discord Levels (Label Toggle)
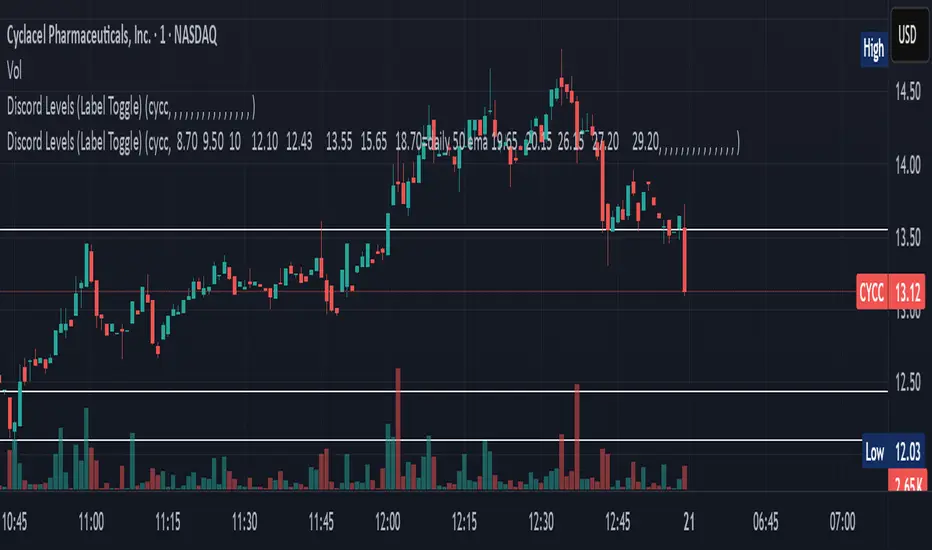
This indicator is designed to streamline your multi-asset level tracking by displaying custom price levels directly on your chart for up to eight different stocks. It allows you to define key support, resistance, and moving average levels, enhancing your analysis across various instruments.
Key Features:
Multi-Stock Level Display: Track important levels for up to 8 distinct stock symbols simultaneously.
Customizable Level Inputs: Define all your desired price levels using a simple space-separated string for each stock.
Intelligent Color-Coding: Levels are automatically color-coded for quick identification based on the associated notes in your input string:
White Line: Standard price levels (e.g., 123.45).
Yellow Line: Levels designated as 200 Daily EMA (e.g., 18.70=daily 200 ema).
Blue Line: Levels designated as 50 Daily EMA (e.g., 18.70=daily 50 ema).
Gray Line: Levels designated as 34 Daily EMA (e.g., 18.70=daily 34 ema).
Green Line: Levels designated as 9 Daily EMA (e.g., 18.70=daily 9 ema).
Red Line: Critical or Cautionary levels (e.g., 9.00=cautionary).
Dynamic Label Positioning: Price labels are displayed next to the lines, dynamically positioned to the right of the current bar (30 bars offset) for optimal visibility across different timeframes.
Global Label Toggle: Easily enable or disable all price labels from the indicator's settings.
How to Use:
Input Stock Symbol: For each slot (Stock 1 to Stock 8) you wish to use, enter the exact TradingView symbol (e.g., AAPL, MSFT, TSLA).
Input Levels String: In the corresponding "Levels" input field, enter your desired price levels separated by spaces.
Basic Level: Just enter the number (e.g., 12.34).
Levels with Notes: Use the format PRICE=NOTE for specific annotations (e.g., 18.70=daily 200 ema, 9.00=cautionary).
Supported Notes for Automatic Coloring: daily 200 ema, daily 50 ema, daily 34 ema, daily 9 ema, cautionary, critical. (Case-insensitive)
Manage Slots: If you need to track more than 8 stocks, simply clear the symbol and levels for an old stock and use that slot for your new entry.
This indicator is a powerful tool for traders who rely on fixed price levels and moving averages across multiple securities, providing clear visual cues without cluttering your main chart analysis.
Script open-source
Dans l'esprit TradingView, le créateur de ce script l'a rendu open source afin que les traders puissent examiner et vérifier ses fonctionnalités. Bravo à l'auteur! Bien que vous puissiez l'utiliser gratuitement, n'oubliez pas que la republication du code est soumise à nos Règles.
Clause de non-responsabilité
Les informations et publications ne sont pas destinées à être, et ne constituent pas, des conseils ou recommandations financiers, d'investissement, de trading ou autres fournis ou approuvés par TradingView. Pour en savoir plus, consultez les Conditions d'utilisation.