PROTECTED SOURCE SCRIPT
Intraday Market Sentiment @LogicQuest
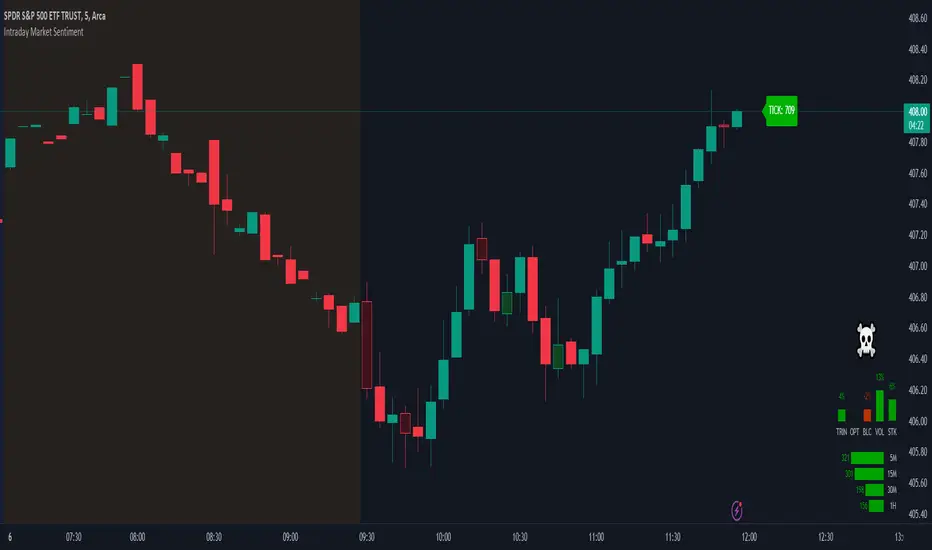
The indicator is designed for use on US stock exchanges during the main trading session. The indicator is a tool for analyzing intraday sentiment in the stock market.
The indicator displays the difference between buying and selling volumes based on the following metrics.
1. TICK - average tick data values for specific time intervals.
2. TRIN (short arbitrage index) - detecting buying and selling pressure and possible trend reversal points.
3. Options - the ratio of purchased and sold option contracts.
4. Blocks - the ratio between the number of shares bought and sold in large blocks.
5. Volumes - the ratio between buying and selling volume.
6. Stocks - the ratio between the number of rising and falling stocks.
7. Price divergence and tick volume.
The data calculation on the chart depends on the settings chosen by the user.
Script protégé
Ce script est publié en source fermée. Cependant, vous pouvez l'utiliser librement et sans aucune restriction – pour en savoir plus, cliquez ici.
Clause de non-responsabilité
Les informations et publications ne sont pas destinées à être, et ne constituent pas, des conseils ou recommandations financiers, d'investissement, de trading ou autres fournis ou approuvés par TradingView. Pour en savoir plus, consultez les Conditions d'utilisation.