OPEN-SOURCE SCRIPT
Mis à jour Running Minimum High
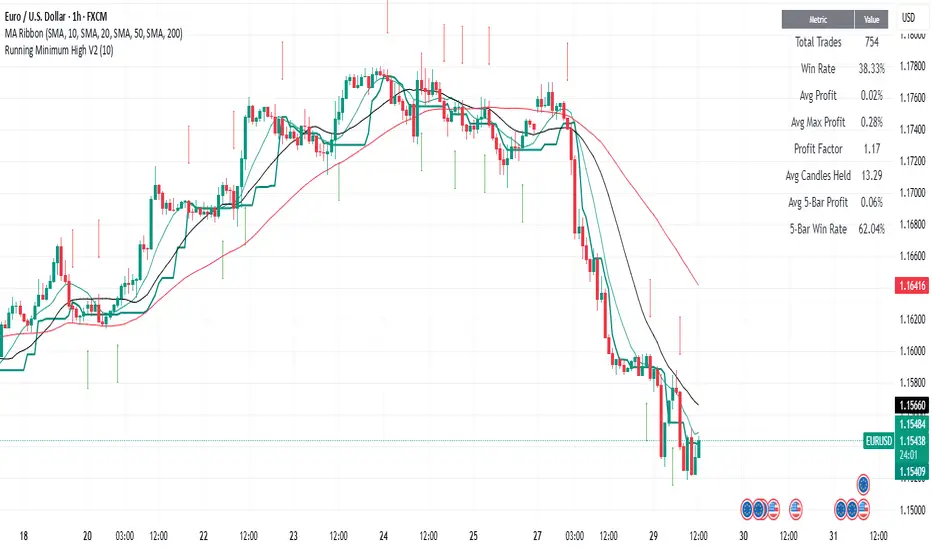
The running minimum high looks at the minimum high from a defined lookback period (default 10 days) and plots that on the price chart. Green arrows signify when the low of the candle is above the running minimum high (suggesting an uptrend), and red arrows signify when the high of the candle is below the running minimum high (suggesting a downtrend).
It is recommended to use this on high timeframes (e.g. 1 hour and above) given the high number of signals it generates on lower timeframes.
It is recommended to use this on high timeframes (e.g. 1 hour and above) given the high number of signals it generates on lower timeframes.
Notes de version
The running minimum high looks at the minimum high from a defined lookback period (default 10 days) and plots that on the price chart. Green arrows signify when the low of the candle is above the running minimum high (suggesting an uptrend), and red arrows signify when the close of the candle is below the running minimum high (suggesting a downtrend).It is recommended to use this on high timeframes (e.g. 1 hour and above) given the high number of signals it generates on lower timeframes.
EDIT: Changed exit signal to when close is below minimum high.
Notes de version
JULY 29TH UPDATE: Includes profit table, which shows overall profit calculations and profit after 5 bars with the option to show the profits in pips (EUR-USD style) for FOREX,Script open-source
Dans l'esprit TradingView, le créateur de ce script l'a rendu open source afin que les traders puissent examiner et vérifier ses fonctionnalités. Bravo à l'auteur! Bien que vous puissiez l'utiliser gratuitement, n'oubliez pas que la republication du code est soumise à nos Règles.
Clause de non-responsabilité
Les informations et publications ne sont pas destinées à être, et ne constituent pas, des conseils ou recommandations financiers, d'investissement, de trading ou autres fournis ou approuvés par TradingView. Pour en savoir plus, consultez les Conditions d'utilisation.
Script open-source
Dans l'esprit TradingView, le créateur de ce script l'a rendu open source afin que les traders puissent examiner et vérifier ses fonctionnalités. Bravo à l'auteur! Bien que vous puissiez l'utiliser gratuitement, n'oubliez pas que la republication du code est soumise à nos Règles.
Clause de non-responsabilité
Les informations et publications ne sont pas destinées à être, et ne constituent pas, des conseils ou recommandations financiers, d'investissement, de trading ou autres fournis ou approuvés par TradingView. Pour en savoir plus, consultez les Conditions d'utilisation.