INVITE-ONLY SCRIPT
Omega
Mis à jour
While others Seek Alpha, we seek Omega™
Market tops and Bottoms on any time frame and at your fingertips
Leave Nothing On The Table
Stop Guessing - Start Profiting - Stop Watching - Start Living
Enjoy,
Arbitrage Trade Team
Market tops and Bottoms on any time frame and at your fingertips
Leave Nothing On The Table
Stop Guessing - Start Profiting - Stop Watching - Start Living
Enjoy,
Arbitrage Trade Team
Notes de version
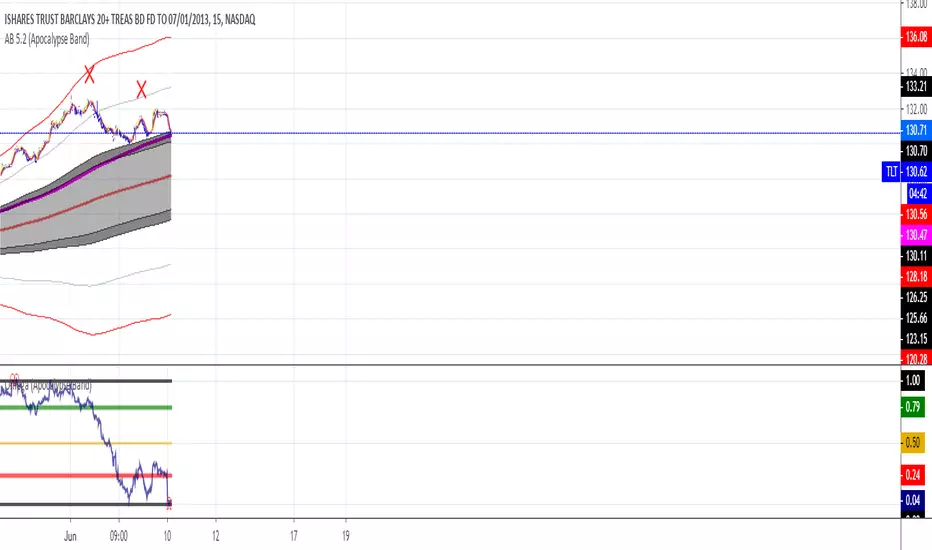
Alerts AddedOmega crossing under green line - Down Entry
Omega crossing over red line - Up Entry
Omega = 1 - Topping Detected
Omega = 0 - Bottoming Detected
Fibonacci retracements ratios are often used to identify the end of a correction or a counter-trend bounce. Most reversals happen between 38.2 and 61.8 since this covers the larger part of the volatility range and is closest to the stock’s average price and momentum.
Think of Fibonacci retracement ratios like the presto-logs from Back to the Future III. And just in case you don’t know what a presto-log is, here is a quick overview on it’s origin. It was an artificial fuel for wood burning stoves developed in the 1930’s as a means of recycling the sawdust from sawmills.
So in Back to the Future, Dr. Emmett Brown created his own. In his adaptation, each log would burn hotter based on color; green being the coolest and least volatile and red being the hottest and most volatile.
Well in Arbitrage, Fibonacci retracement ratios are used as a way to illustrate support and resistance within the Omega™ Indicator. So as volatility increases and decreases, these lines help to mark subtle changes in speed and volatility.
Pro Tip: Down happens fast and is at the bottom of the Omega Range and up happens slowly and is near the top.
As an buy trend progresses volatility and momentum eventually reaches 0 and the equity tops. Likewise when a downtrend begins it accelerates until it reaches terminal velocity and then begins to slow down because it is not maintainable.
Enjoy,
Arbitrage Trade
Notes de version
updated to version 5 of the pine editor language and added cross time frame analytics. Script sur invitation seulement
L'accès à ce script est limité aux utilisateurs autorisés par l'auteur et nécessite généralement un paiement. Vous pouvez l'ajouter à vos favoris, mais vous ne pourrez l'utiliser qu'après avoir demandé et obtenu l'autorisation de son auteur. Contactez aixguru pour plus d'informations, ou suivez les instructions de l'auteur ci-dessous.
TradingView ne suggère pas de payer pour un script et de l'utiliser à moins que vous ne fassiez confiance à 100% à son auteur et que vous compreniez comment le script fonctionne. Dans de nombreux cas, vous pouvez trouver une bonne alternative open-source gratuite dans nos Scripts communautaires.
Instructions de l'auteur
″Speed of trend
Vous voulez utiliser ce script sur un graphique ?
Avertissement: veuillez lire avant de demander l'accès.
Clause de non-responsabilité
Les informations et les publications ne sont pas destinées à être, et ne constituent pas, des conseils ou des recommandations en matière de finance, d'investissement, de trading ou d'autres types de conseils fournis ou approuvés par TradingView. Pour en savoir plus, consultez les Conditions d'utilisation.