OPEN-SOURCE SCRIPT
Mis à jour Previous Day Week Highs & Lows

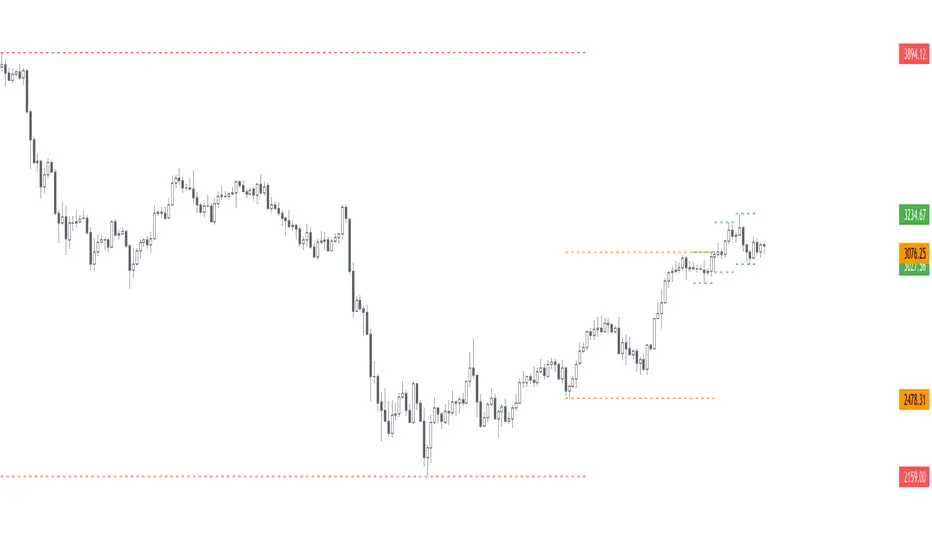
This script plots the previous n day and week highs and lows (previous two days and previous week by default).
Here are some additional info about the script behavior:
Here are some additional info about the script behavior:
- Plots highs and/or lows
- Plots for days and/or weeks
- Day highs and lows are shown only on intraday timeframes
- Week highs and lows are shown only on timeframes < weekly
Notes de version
- Add previous month(s) high(s) and low(s)
- Minor fixes and improvements
Script open-source
Dans l'esprit TradingView, le créateur de ce script l'a rendu open source afin que les traders puissent examiner et vérifier ses fonctionnalités. Bravo à l'auteur! Bien que vous puissiez l'utiliser gratuitement, n'oubliez pas que la republication du code est soumise à nos Règles.
🌟 Listed as "Trusted Pine Programmer"
👨💻 Coding services: sbtnc.dev/hire-pine-script-developer
🔒 Premium indicators: sbtnc.gumroad.com
☕️ Tip: buymeacoffee.com/sbtnc
👨💻 Coding services: sbtnc.dev/hire-pine-script-developer
🔒 Premium indicators: sbtnc.gumroad.com
☕️ Tip: buymeacoffee.com/sbtnc
Clause de non-responsabilité
Les informations et publications ne sont pas destinées à être, et ne constituent pas, des conseils ou recommandations financiers, d'investissement, de trading ou autres fournis ou approuvés par TradingView. Pour en savoir plus, consultez les Conditions d'utilisation.