OPEN-SOURCE SCRIPT
Volume Anomaly Detector
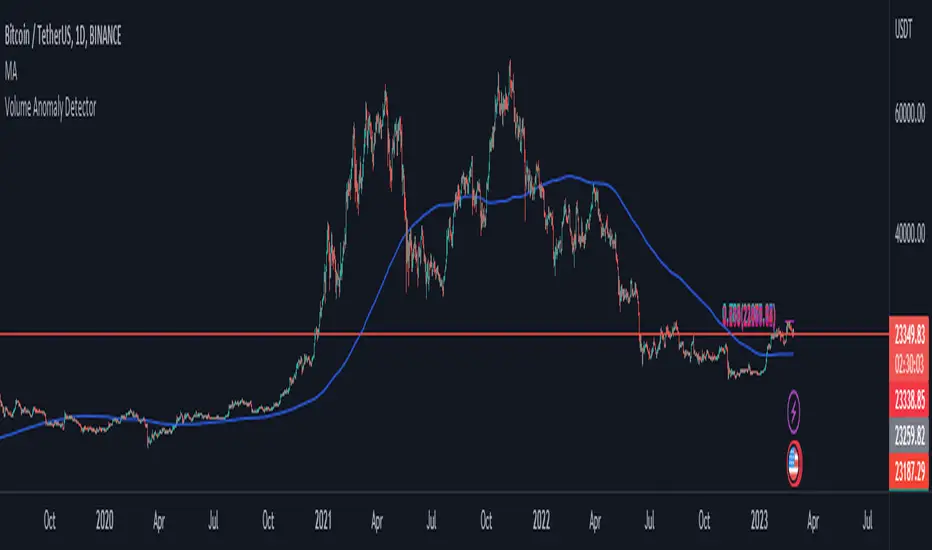
This indicator is designed to detect volume anomalies such as block orders, large institutional orders, and sweep orders. It works by comparing the current volume to the moving average of volume and identifying deviations that exceed a specified threshold. By detecting anomalous volume, it can help traders identify potential market-moving events and anticipate changes in price direction.
One key difference between this indicator and others is its focus on volume anomalies rather than just overall volume or price movements. This can provide traders with additional insights into market conditions and help them identify trading opportunities that may not be visible using other indicators.
In terms of timeframe and market conditions, this indicator can be used on any timeframe and in any market where volume data is available. However, it may be particularly useful in markets with high liquidity and significant institutional participation, such as equities and futures markets. It may also be most effective during periods of heightened volatility or when significant news or events are expected to impact the market. As with any trading indicator, it's important to use it in conjunction with other tools and analysis to confirm signals and make informed trading decisions.
Script open-source
Dans l'esprit TradingView, le créateur de ce script l'a rendu open source afin que les traders puissent examiner et vérifier ses fonctionnalités. Bravo à l'auteur! Bien que vous puissiez l'utiliser gratuitement, n'oubliez pas que la republication du code est soumise à nos Règles.
Clause de non-responsabilité
Les informations et publications ne sont pas destinées à être, et ne constituent pas, des conseils ou recommandations financiers, d'investissement, de trading ou autres fournis ou approuvés par TradingView. Pour en savoir plus, consultez les Conditions d'utilisation.