OPEN-SOURCE SCRIPT
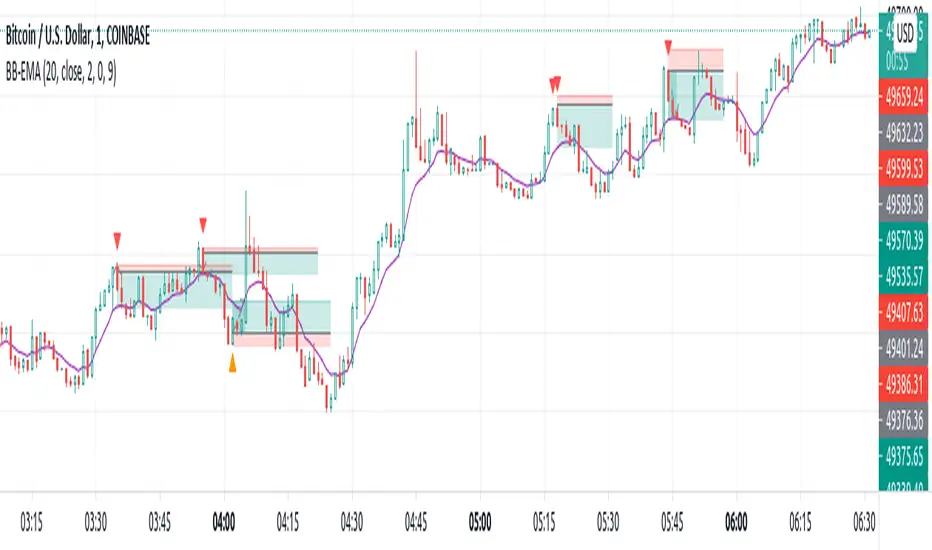
Bollinger bands + EMA

I discovered a video on YouTube which was published on Jan 22, 2021. I just coded on TradingView. It's performing better in smaller TimeFrames (1m, 5m, ...).
How does it work? How to use?
This is based on Bollinger Bands and Exponential Moving Average. The logic is so simple: It will wait until the a candle starts to poke out of the BB. When it figures out a price outside the band, it will be altered for next candle. If the next candle close back inside the band, it will be marked with a up triangle (for long positions) or down triangle (for short positions). The take profit level would be the Exponential Moving Average.
It can be used as a confirmation alongside other techno fundamental tools and analysis.
P.S. As it's prohibited by community rules to link to outside, while it seems to be a kind of advertisement, I cannot share the link to the video. Cheers to those creative and kind YouTubers!
Script open-source
Dans l'esprit de TradingView, le créateur de ce script l'a rendu open-source, afin que les traders puissent examiner et vérifier sa fonctionnalité. Bravo à l'auteur! Vous pouvez l'utiliser gratuitement, mais n'oubliez pas que la republication du code est soumise à nos Règles.
Clause de non-responsabilité
Les informations et les publications ne sont pas destinées à être, et ne constituent pas, des conseils ou des recommandations en matière de finance, d'investissement, de trading ou d'autres types de conseils fournis ou approuvés par TradingView. Pour en savoir plus, consultez les Conditions d'utilisation.