Volatility Based Momentum by QTX Algo Systems
Overview
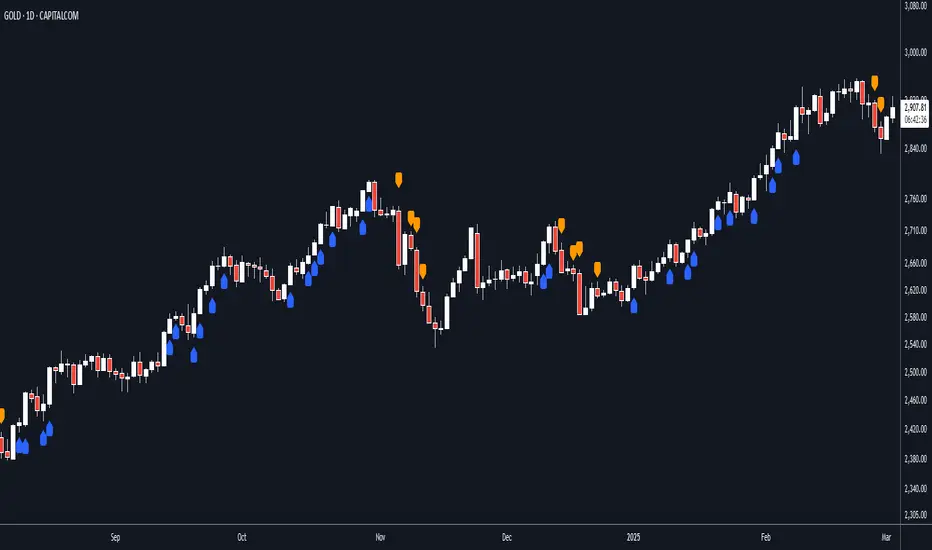
This indicator is designed to determine whether a market trend is genuinely supported by both momentum and volatility. It produces per-candle signals when a smoothed momentum oscillator is above its moving average, a Price – Moving Average Ratio confirms overall trend strength by remaining above a preset level with a positive slope, and when at least one of two distinct volatility metrics is rising. This integrated approach offers traders a consolidated and dynamic view of market energy, delivering more actionable insights than a simple merger of standard indicators.
How It Works
The indicator fuses two complementary volatility measures with dual momentum assessments to ensure robust signal generation. One volatility metric evaluates long-term market behavior by analyzing the dispersion of logarithmic price changes, while the other—derived from a Bollinger Band Width Percentile—captures recent price variability and confirms that market volatility remains above a minimum threshold. A trading signal is generated only when at least one of these volatility measures shows a sustained upward trend over several candles.
For momentum, a double‐smoothed Stochastic Momentum Index provides a refined, short-term view of price action, filtering out market noise. In addition, the PMARP serves as a confirmation tool by comparing the current price to its moving average, requiring that its value remains above a defined level with a positive slope to indicate a strong trend. Together, these elements ensure that a signal is only produced when both the market’s momentum and volatility are in alignment.
Although the components used are based on well-known technical analysis methods, the thoughtful integration of these elements creates a tool that is more than the sum of its parts. By combining long-term volatility assessment with a real-time measure of recent price variability—and by merging short-term momentum analysis with a confirmation of overall trend strength—the indicator delivers a more reliable and comprehensive view of market energy. This holistic approach distinguishes it from standard indicators.
How to Use
Traders can adjust the volatility threshold setting to tailor the indicator to their preferred market or timeframe. The indicator displays per-candle signals when both the refined momentum criteria and the dynamic volatility conditions are met. These signals are intended to be used as part of a broader trading strategy, in conjunction with other technical analysis tools for confirming entries and exits.
Disclaimer
This indicator is for educational purposes only and is intended to support your trading strategy. It does not guarantee performance, and past results are not indicative of future outcomes. Always use proper risk management and perform your own analysis before trading.
Script sur invitation seulement
Seuls les utilisateurs approuvés par l'auteur peuvent accéder à ce script. Vous devrez demander et obtenir l'autorisation pour l'utiliser. Celle-ci est généralement accordée après paiement. Pour plus de détails, suivez les instructions de l'auteur ci-dessous ou contactez directement QTXAlgoSystems.
TradingView ne recommande PAS d'acheter ou d'utiliser un script à moins que vous ne fassiez entièrement confiance à son auteur et que vous compreniez son fonctionnement. Vous pouvez également trouver des alternatives gratuites et open source dans nos scripts communautaires.
Instructions de l'auteur
Clause de non-responsabilité
Script sur invitation seulement
Seuls les utilisateurs approuvés par l'auteur peuvent accéder à ce script. Vous devrez demander et obtenir l'autorisation pour l'utiliser. Celle-ci est généralement accordée après paiement. Pour plus de détails, suivez les instructions de l'auteur ci-dessous ou contactez directement QTXAlgoSystems.
TradingView ne recommande PAS d'acheter ou d'utiliser un script à moins que vous ne fassiez entièrement confiance à son auteur et que vous compreniez son fonctionnement. Vous pouvez également trouver des alternatives gratuites et open source dans nos scripts communautaires.