OPEN-SOURCE SCRIPT
Mis à jour ADX and DI+ v4.5 Optimized
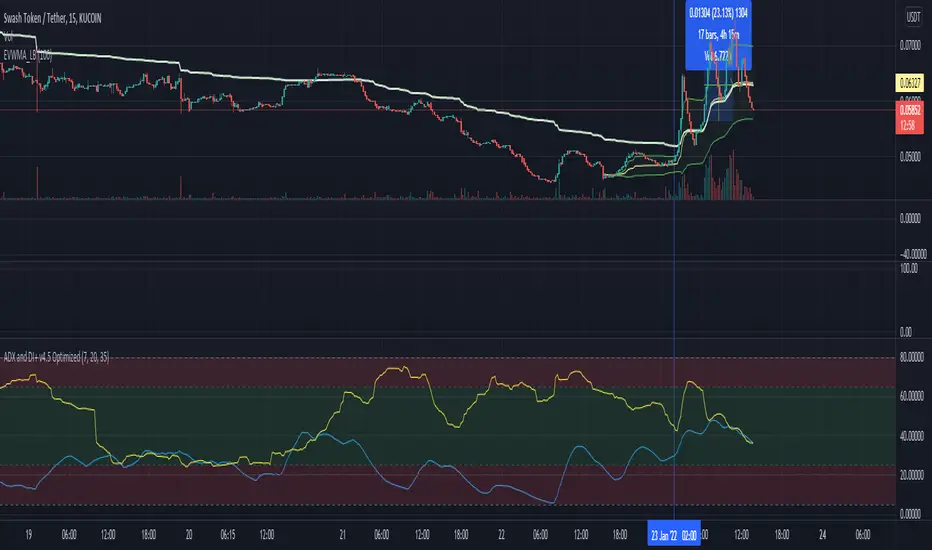
This script plots VWMA(ADX) vs EMA(DI+) under pre-set time frame.
Feature:
The Main Strategy is to look for potential BUY opportunity (Intraday trading, Session trading, Swing) when EMA(DI+) colored blue, entering upward into Green zone where ADX counterpart (default colored: Yellow) is also present.
Formula plot is also helpful to understand upcoming downtrend signal when both blue and yellow lines try to make diverted bifurcation like pattern on graph.
Disclaimer- This is an indicator script and not final Buy and Sell advice.
* Originally developed by © BeikabuOyaji and further extended & optimized by Bharat imbharat to serve above features
Notes de version
Some minor format corrections.Script is intact.
Script open-source
Dans l'esprit TradingView, le créateur de ce script l'a rendu open source afin que les traders puissent examiner et vérifier ses fonctionnalités. Bravo à l'auteur! Bien que vous puissiez l'utiliser gratuitement, n'oubliez pas que la republication du code est soumise à nos Règles.
Clause de non-responsabilité
Les informations et publications ne sont pas destinées à être, et ne constituent pas, des conseils ou recommandations financiers, d'investissement, de trading ou autres fournis ou approuvés par TradingView. Pour en savoir plus, consultez les Conditions d'utilisation.