OPEN-SOURCE SCRIPT
Mis à jour Volume Metrics & Market Capitalization

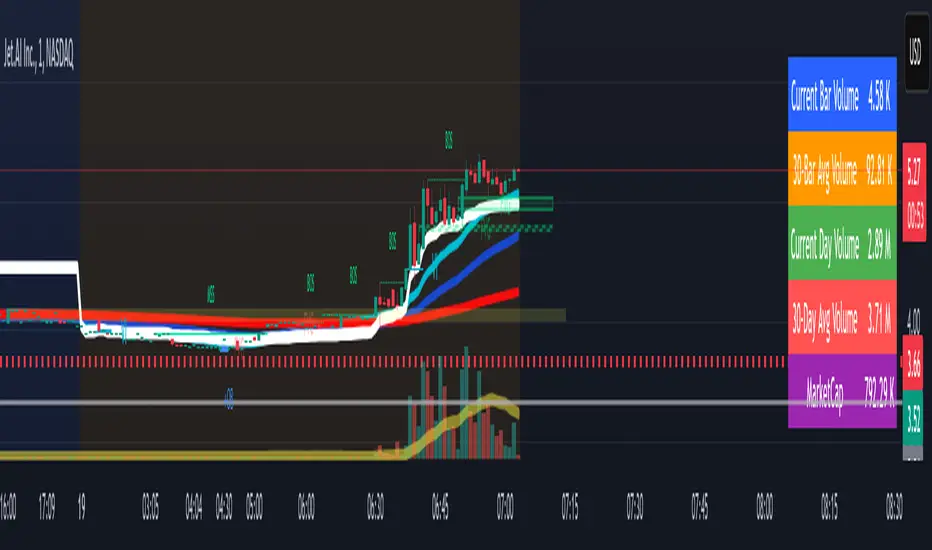
This Pine Script indicator provides a comparative view of volume metrics and market capitalization to help traders analyze relative volume strength in the context of a stock’s overall size.
Key Features:
Volume Formatting:
Converts numerical values into readable units (K for thousand, M for million, B for billion, T for trillion).
Volume Metrics:
Displays current bar volume, cumulative daily volume, and 30-day average volume.
Market Capitalization Calculation:
Uses the outstanding shares multiplied by closing price to estimate market cap.
Table Display:
Shows all these values in an easy-to-read table in the bottom-right of the chart.
How It Helps Compare Relative Volume to Market Cap
Relative Volume Strength
By comparing current volume and 30-day average volume, traders can quickly gauge if today’s volume is unusually high or low.
If daily volume exceeds the 30-day average, it suggests increased market interest in the stock.
Market Cap Context
Market cap provides a reference for whether a stock is large-cap, mid-cap, or small-cap, influencing how volume should be interpreted.
A high volume surge in a low market cap stock may indicate stronger momentum compared to the same volume change in a large-cap stock.
Liquidity and Volatility Signals
Comparing volume to market cap helps determine liquidity—stocks with low market cap but high volume may be more volatile.
Example: A small-cap stock with $50M market cap trading $20M daily volume is seeing 40% turnover, a significant indicator of strong movement.
Practical Use Case
Day Traders: Spot stocks experiencing unusual volume surges relative to their market cap, identifying potential breakout or momentum plays.
Swing Traders: Assess if a stock is trading at above-average volume levels, confirming strength in trends.
Investors: Understand liquidity and potential institutional interest in stocks, as larger players typically trade in high market-cap names with sustained volume.
This indicator is a quick-glance tool for identifying high-volume stocks relative to their size, helping traders make more informed decisions on potential opportunities. 🚀
Notes de version
- Added 30-Bar Average Volume.Script open-source
Dans l'esprit TradingView, le créateur de ce script l'a rendu open source afin que les traders puissent examiner et vérifier ses fonctionnalités. Bravo à l'auteur! Bien que vous puissiez l'utiliser gratuitement, n'oubliez pas que la republication du code est soumise à nos Règles.
Clause de non-responsabilité
Les informations et publications ne sont pas destinées à être, et ne constituent pas, des conseils ou recommandations financiers, d'investissement, de trading ou autres fournis ou approuvés par TradingView. Pour en savoir plus, consultez les Conditions d'utilisation.
Script open-source
Dans l'esprit TradingView, le créateur de ce script l'a rendu open source afin que les traders puissent examiner et vérifier ses fonctionnalités. Bravo à l'auteur! Bien que vous puissiez l'utiliser gratuitement, n'oubliez pas que la republication du code est soumise à nos Règles.
Clause de non-responsabilité
Les informations et publications ne sont pas destinées à être, et ne constituent pas, des conseils ou recommandations financiers, d'investissement, de trading ou autres fournis ou approuvés par TradingView. Pour en savoir plus, consultez les Conditions d'utilisation.