PROTECTED SOURCE SCRIPT
Intra Candle Volume Distribution @MaxMaserati2.0
INTRA CANDLE VOLUME DISTRIBUTION @MaxMaserati2.0
- Advanced Intra-Candle Distribution Mapping-
Discover the hidden volume dynamics within each candle! This revolutionary indicator analyzes buying vs selling pressure at multiple price levels INSIDE individual candles, revealing volume distribution patterns that traditional indicators completely miss.
✨ KEY FEATURES:
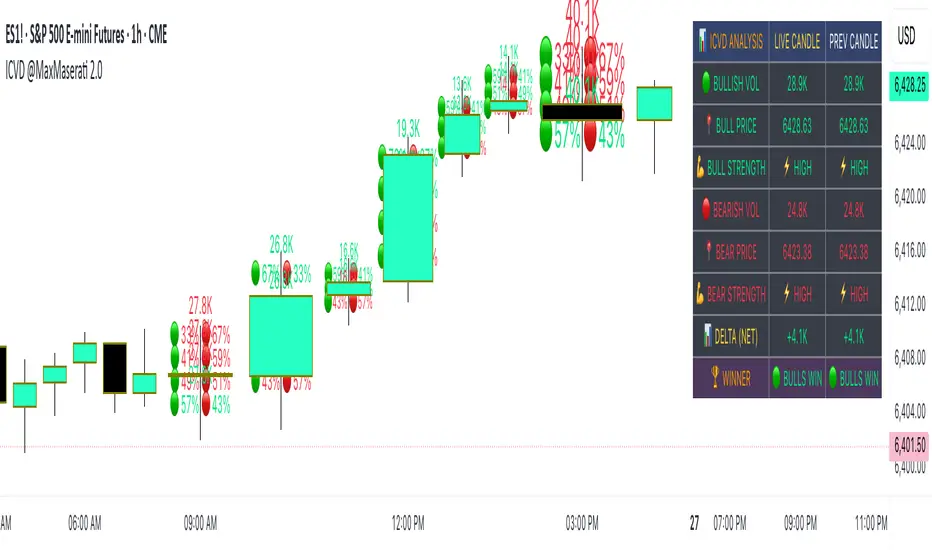
📊 Real-time volume distribution analysis at 4 price levels per candle
🎯 Smart detection - only shows significant volume concentrations
🏆 Winner-only mode for clean, directional signals
📈 Delta analysis showing net buying/selling pressure
📋 Comprehensive statistics table with live and historical data
🎨 Fully customizable colors, sizes, and display options
Selection to see the volume battle between buyer and sellers inside of the candle
Great, if you like to know the why's

🔍 WHAT MAKES IT UNIQUE:
- Advanced algorithms distribute volume across price levels within each candle
- Intelligent filtering eliminates noise, showing only significant volume zones
- Dynamic dot sizing based on volume intensity
- Real-time table comparing current vs previous candle metrics
- Multi-timeframe compatible (works on all timeframes)
- Professional-grade order flow analysis
📚 PERFECT FOR:
- Scalpers seeking precise entry/exit points
- Day traders validating breakouts and reversals
- Volume analysis specialists
- Order flow traders
- Institutional-style analysis on retail platforms
When only the winner (Strongest pressure) of the candle is selected
Better for fast decision making

When the delta is selected
Great to have clear idea of the net volume

🛠️ HOW TO USE:
Simply add to chart and customize to your preference. Green dots = bulls dominating that price level, red dots = bears dominating. Larger dots = higher volume intensity. Use the comprehensive table for detailed volume distribution analysis.
⚡ PERFORMANCE OPTIMIZED:
Efficient code ensures smooth operation without chart lag, even with maximum visual elements.
- Advanced Intra-Candle Distribution Mapping-
Discover the hidden volume dynamics within each candle! This revolutionary indicator analyzes buying vs selling pressure at multiple price levels INSIDE individual candles, revealing volume distribution patterns that traditional indicators completely miss.
✨ KEY FEATURES:
📊 Real-time volume distribution analysis at 4 price levels per candle
🎯 Smart detection - only shows significant volume concentrations
🏆 Winner-only mode for clean, directional signals
📈 Delta analysis showing net buying/selling pressure
📋 Comprehensive statistics table with live and historical data
🎨 Fully customizable colors, sizes, and display options
Selection to see the volume battle between buyer and sellers inside of the candle
Great, if you like to know the why's
🔍 WHAT MAKES IT UNIQUE:
- Advanced algorithms distribute volume across price levels within each candle
- Intelligent filtering eliminates noise, showing only significant volume zones
- Dynamic dot sizing based on volume intensity
- Real-time table comparing current vs previous candle metrics
- Multi-timeframe compatible (works on all timeframes)
- Professional-grade order flow analysis
📚 PERFECT FOR:
- Scalpers seeking precise entry/exit points
- Day traders validating breakouts and reversals
- Volume analysis specialists
- Order flow traders
- Institutional-style analysis on retail platforms
When only the winner (Strongest pressure) of the candle is selected
Better for fast decision making
When the delta is selected
Great to have clear idea of the net volume
🛠️ HOW TO USE:
Simply add to chart and customize to your preference. Green dots = bulls dominating that price level, red dots = bears dominating. Larger dots = higher volume intensity. Use the comprehensive table for detailed volume distribution analysis.
⚡ PERFORMANCE OPTIMIZED:
Efficient code ensures smooth operation without chart lag, even with maximum visual elements.
Script protégé
Ce script est publié en source fermée. Toutefois, vous pouvez l'utiliser librement et sans aucune restriction - en savoir plus ici.
MMM : No body close (PO4), No Trade.
Clause de non-responsabilité
Les informations et les publications ne sont pas destinées à être, et ne constituent pas, des conseils ou des recommandations en matière de finance, d'investissement, de trading ou d'autres types de conseils fournis ou approuvés par TradingView. Pour en savoir plus, consultez les Conditions d'utilisation.