OPEN-SOURCE SCRIPT
Mis à jour Volume Zone Oscillator by [VanHelsig]
Volume Zone Oscillator
How volume zone oscillator work:
Like other VZO it uses the same principle of calculation Volume direction divided on total volume and then scaled to 100 and -100.
When we have positive momentum close > close[loockback] we have value of positive Volume, other way we have -volume negative one. <- this called a volume direction
Total volume is simply moving average with source of volume
And then MA with source of volume direction divided on MA of total colume and scaled it from 100 to -100
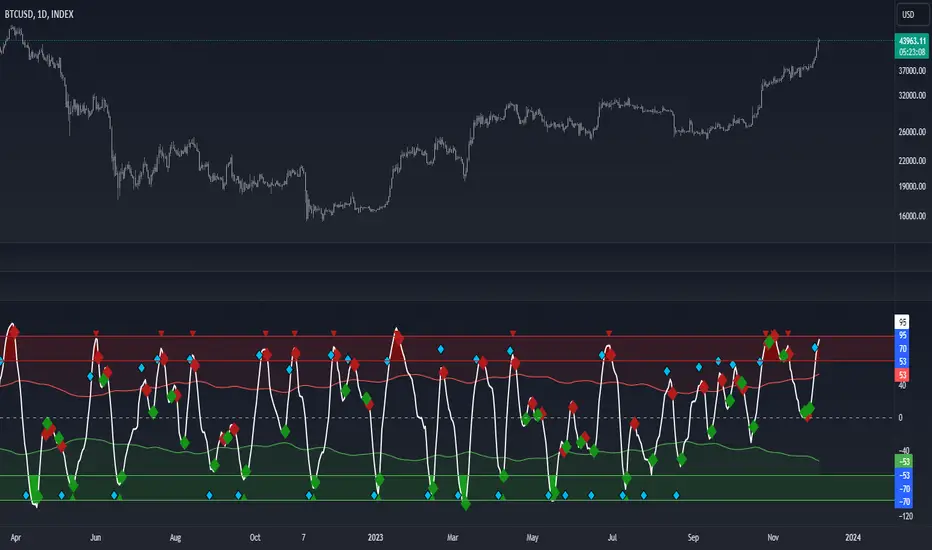
Basically we have few signals what VZO can show:
-Strong buy in oversold zone and strong sell in overbought zone. (Triangles at the top red and at the bottom green)
-Local Buy and Sell (Green and red Robustnesses)
-Posibility of trend change (Blue robustness)
Also you can webhook alerts to your spread sheet that sends values 1 for buys signals and -1 for sell signals in a range of 1 to 10 days
Here you can see marked signals on the chart

How volume zone oscillator work:
Like other VZO it uses the same principle of calculation Volume direction divided on total volume and then scaled to 100 and -100.
When we have positive momentum close > close[loockback] we have value of positive Volume, other way we have -volume negative one. <- this called a volume direction
Total volume is simply moving average with source of volume
And then MA with source of volume direction divided on MA of total colume and scaled it from 100 to -100
Basically we have few signals what VZO can show:
-Strong buy in oversold zone and strong sell in overbought zone. (Triangles at the top red and at the bottom green)
-Local Buy and Sell (Green and red Robustnesses)
-Posibility of trend change (Blue robustness)
Also you can webhook alerts to your spread sheet that sends values 1 for buys signals and -1 for sell signals in a range of 1 to 10 days
Here you can see marked signals on the chart
Notes de version
Updated calculations and backtested. Notes de version
-Notes de version
BackTest BTC Index (BackTest of local buys and local sells) BackTest ETH Index
https://www.tradingview.com/x/Dxb8cWuv/
Notes de version
Organazide code, changed default inputsScript open-source
Dans l'esprit TradingView, le créateur de ce script l'a rendu open source afin que les traders puissent examiner et vérifier ses fonctionnalités. Bravo à l'auteur! Bien que vous puissiez l'utiliser gratuitement, n'oubliez pas que la republication du code est soumise à nos Règles.
Clause de non-responsabilité
Les informations et publications ne sont pas destinées à être, et ne constituent pas, des conseils ou recommandations financiers, d'investissement, de trading ou autres fournis ou approuvés par TradingView. Pour en savoir plus, consultez les Conditions d'utilisation.
Script open-source
Dans l'esprit TradingView, le créateur de ce script l'a rendu open source afin que les traders puissent examiner et vérifier ses fonctionnalités. Bravo à l'auteur! Bien que vous puissiez l'utiliser gratuitement, n'oubliez pas que la republication du code est soumise à nos Règles.
Clause de non-responsabilité
Les informations et publications ne sont pas destinées à être, et ne constituent pas, des conseils ou recommandations financiers, d'investissement, de trading ou autres fournis ou approuvés par TradingView. Pour en savoir plus, consultez les Conditions d'utilisation.