OPEN-SOURCE SCRIPT
Mis à jour ADR & ATR Extension from EMA

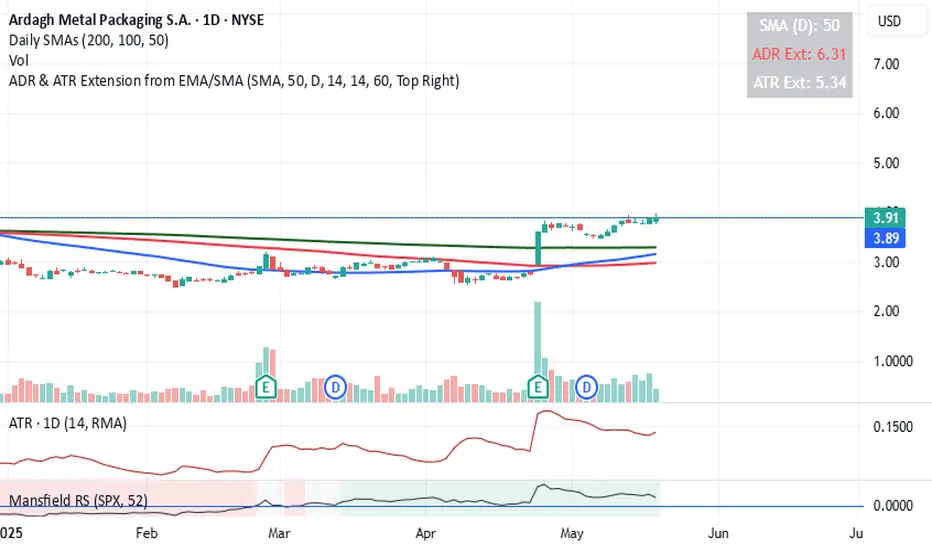
This indicator helps identify how extended the current price is from a chosen Exponential Moving Average (EMA) in terms of both Average Daily Range (ADR) and Average True Range (ATR).
It calculates:
ADR Extension = (Price - EMA) / ADR
ATR Extension = (Price - EMA) / ATR
The results are shown in a floating table on the chart.
The ADR line turns red if the price is more than 4 ADRs above the selected EMA
Customization Options:
- Select EMA length
- Choose between close or high as price input
- Set ADR and ATR periods
- Customize the label’s position, color, and transparency
- Use the chart's timeframe or a fixed timeframe
Notes de version
This indicator helps identify how extended the current price is from a chosen Moving Average (EMA or SMA) in terms of both Average Daily Range (ADR) and Average True Range (ATR).It calculates:
ADR Extension = (Price - EMA) / ADR
ATR Extension = (Price - EMA) / ATR
The results are shown in a floating table on the chart.
The ADR line turns red if the price is more than 4 ADRs above the selected EMA
Customization Options:
- Select between Exponential and Simple moving average
- Select MA length
- Choose between close or high as price input
- Set ADR and ATR periods
- Customize the label’s position, color, and transparency
- Use the chart's timeframe or a fixed timeframe
Notes de version
- Bug fixScript open-source
Dans l'esprit TradingView, le créateur de ce script l'a rendu open source afin que les traders puissent examiner et vérifier ses fonctionnalités. Bravo à l'auteur! Bien que vous puissiez l'utiliser gratuitement, n'oubliez pas que la republication du code est soumise à nos Règles.
Clause de non-responsabilité
Les informations et publications ne sont pas destinées à être, et ne constituent pas, des conseils ou recommandations financiers, d'investissement, de trading ou autres fournis ou approuvés par TradingView. Pour en savoir plus, consultez les Conditions d'utilisation.
Script open-source
Dans l'esprit TradingView, le créateur de ce script l'a rendu open source afin que les traders puissent examiner et vérifier ses fonctionnalités. Bravo à l'auteur! Bien que vous puissiez l'utiliser gratuitement, n'oubliez pas que la republication du code est soumise à nos Règles.
Clause de non-responsabilité
Les informations et publications ne sont pas destinées à être, et ne constituent pas, des conseils ou recommandations financiers, d'investissement, de trading ou autres fournis ou approuvés par TradingView. Pour en savoir plus, consultez les Conditions d'utilisation.