OPEN-SOURCE SCRIPT
Mis à jour Stochastic & RSI
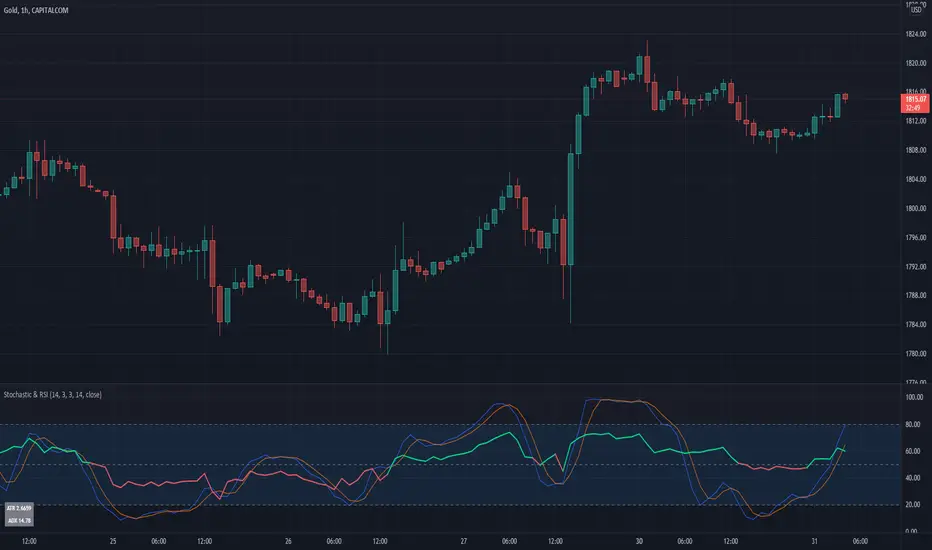
This script is a simple extension of the Built-In Stochastic RSI that also plots the RSI and prints the values of ATR and ADX of the last bar of the current timeframe to a small table in the corner.
The script can be used to define the entry for a trade when the stochastics crossed and RSI is below or above 0.50 (for going long or short).
 BTCUSD
I like to use the Stochastics and RSI indicators for pullback strategies, and with this inidcator you dont have to add both indicators to your setup. The ATR can be used to define the value of your stop-loss and the ADX (e.g. > 25) give you a hint for the strength of the current trend.
The script can be used to define the entry for a trade when the stochastics crossed and RSI is below or above 0.50 (for going long or short).
I like to use the Stochastics and RSI indicators for pullback strategies, and with this inidcator you dont have to add both indicators to your setup. The ATR can be used to define the value of your stop-loss and the ADX (e.g. > 25) give you a hint for the strength of the current trend.
Notes de version
Set the decimals of the ATR to 4 digitsNotes de version
Stochastics separated from RSI and color option for RSI addedNotes de version
Update name and chartNotes de version
Stochastics based on RSI, not close, low and highNotes de version
Add alerts for overbought and oversold entriesNotes de version
Register alert for overbought or oversoldNotes de version
Typo correctedNotes de version
TypoNotes de version
Alert on stochastics cross when oversold or overboughtNotes de version
Upper and lower level of bands as inputNotes de version
Length RSI and stochastics separatedNotes de version
Second RSI added for longer term momentum and trendNotes de version
RSI-based EMA addedScript open-source
Dans l'esprit TradingView, le créateur de ce script l'a rendu open source afin que les traders puissent examiner et vérifier ses fonctionnalités. Bravo à l'auteur! Bien que vous puissiez l'utiliser gratuitement, n'oubliez pas que la republication du code est soumise à nos Règles.
Access our indicators from: indivisionx.com
Clause de non-responsabilité
Les informations et publications ne sont pas destinées à être, et ne constituent pas, des conseils ou recommandations financiers, d'investissement, de trading ou autres fournis ou approuvés par TradingView. Pour en savoir plus, consultez les Conditions d'utilisation.
Script open-source
Dans l'esprit TradingView, le créateur de ce script l'a rendu open source afin que les traders puissent examiner et vérifier ses fonctionnalités. Bravo à l'auteur! Bien que vous puissiez l'utiliser gratuitement, n'oubliez pas que la republication du code est soumise à nos Règles.
Access our indicators from: indivisionx.com
Clause de non-responsabilité
Les informations et publications ne sont pas destinées à être, et ne constituent pas, des conseils ou recommandations financiers, d'investissement, de trading ou autres fournis ou approuvés par TradingView. Pour en savoir plus, consultez les Conditions d'utilisation.