PROTECTED SOURCE SCRIPT
Mis à jour IndianPivotBossMUPS
This is a new avatar of the MUPS (ManojUltimatePivotScalpingStrategy).
This Indicator is to be used with the following Indicators :
1) IndianPivotBossPEMA
2) IndianPivotBossPIVOTRSI
3) IndianPivotBossDPWMACD
4) IndianPivotBossPIVOTSHIFT
BcondA = crossover(close,dtime_up) or low > dtime_up
BcondB = crossover(low,imap) or crossover(low,dpivotema) or crossover(low,imapw) or crossover(low,imapm)
//BcondC = crossover(low,ddtime_pivot)
BcondD = crossover(low,wtime_pivot)
BcondE = crossover(low,mtime_pivot)
BcondF = crossover(low,idtime_pivot)
BcondG = imacd > 0 or imacdw > 0 or imacdm > 0
BcondH = (rsipe > 50 and rsipe > rsippe) or (rsipew > 50 and rsipew > rsippew) or (rsipem > 50 and rsipem > rsippem)
BcondI = crossover(imacd,0) and close > maFast
//BcondI = ( dtime_pwd < ema(dtime_pwd,8) and crossover(low,dtime_r1))
EcondS = (imacd < 0 or crossunder(imacd,0) or close < maSlow) and rsipe < 50 and rsippe < 50 //crossunder(high,dtime_pivot) or crossunder(high,dpivotema) or crossunder(close,wtime_pivot) or crossunder(high,idtime_pivot) or crossunder(rsipe,rsippe) or crossunder(rsipe,50) or crossunder(high,dtime_r1)
Objective :
To enter into a trade when the direction, trend and momentum is confirmed.
Rules :
The following are the broad conditions for taking a long position. Reverse is for Short.
Direction - Defined by price crossing either daily cpr / weekly pivot / monthly pivot / intraday 125 min pivot
Trend - Defined by IndianPivotBossPIVOTSHIFT and IndiaPivotBossDPWMACD. The latter is a variant of the former. The former gives advance indication of a trend, while the latter confirms moments later.
Momentum - Defined by IndianPivotBossPIVOTRSI.
The strategy takes long when direction is established by the price crossing pivots and trend is established with pivot shift indicator sloping upwards which is further confirmed by DPWMACD, which is a variant of pivot shift indicator, crossing midline and sloping upwards and Momentum is established by Pivot RSI indicator when it crosses 50 and is above its own EMA.
Exits are usually at close. In case if the combination fizzles out, the strategy shows exit signal if any of the 3 ie, direction / trend / momentum fizzles out.
It is suggested to close down the positions at day end as sometimes the strategy continues the position overnight if deemed fit.
Other Rules when you take a long trade based on the signal.
1) Ensure the price is above PEMA and PEMA is upward sloping.
2) Ensure the Pivot shift indicator is upward sloping; Ensure the DPWMACD is also upward sloping.
3) Ensure the Daily Pivot RSI is above 50 and is above its own EMA.
This is not a holy grail. Hence have a proper position sizing which is your ultimate defense.
IMPORTANT : WHEN YOU USE THIS INDICATOR ALONG WITH 1,2,3,4 MENTIONED IN THE TOP PORTION OF THIS POST, PLS ENSURE THAT THE STRATEGY CHOSEN IS MUPS AS ALL THOSE MENTIONED ABOVE ARE ALSO STRATEGIES ON ITS OWN. MUPS COMBINES ALL THESE.
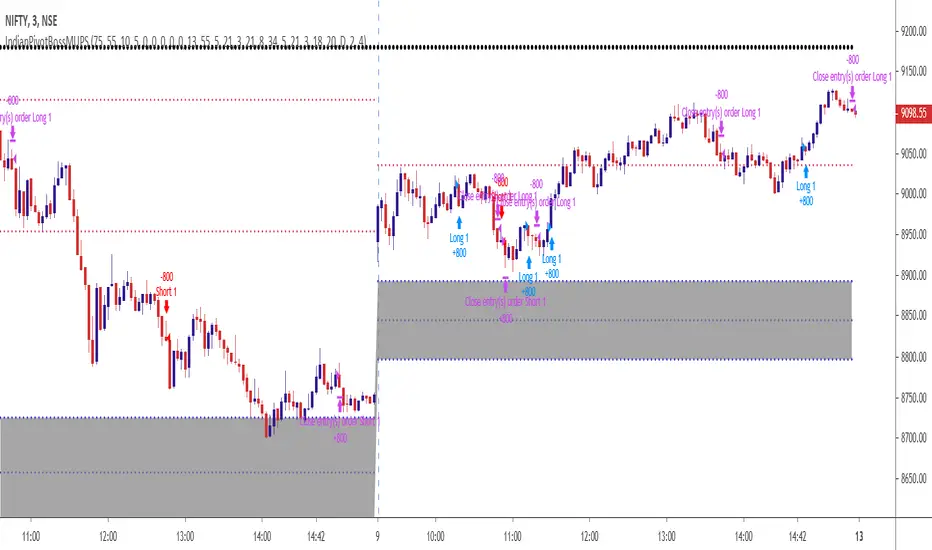
Notes de version
Improved the efficiency of the trading strategy inorder to optimize the performance.Nifty intraday backtesting results on different time frames.
Timeframe % return % trades profitable Profit factor DD no. of trades
1 min 133% 42% 1.95 7% 322
3 min 181% 45% 2.72 15% 297
5 min 122% 40% 1.80 17% 320
10 min 134% 42% 1.6 13% 374
15 min 93% 43% 1.3 19% 427
Idea is that this trading strategy is fairly providing some good backtest outputs in all intraday time frames.
This strategy is a combination of the pivot based advanced concepts which are reflected in the following indicators :
IndianPivotBossMUPS
IndianPivotBossPEMA
IndianPivotBossPivotShift
IndianPivotBossPivotRSI
IndianPivotBossDCPRMACD
Hence it is better to use all the above to analyse or trade.
I have used only one indicator, ie, IndianPivotBossMUPS for publishing in order to comply with the house rules.
Please note that backtest results does not indicate any sort of replication in the future. Hence use at your own risk.
Have a proper risk management. Good Luck.
Script protégé
Ce script est publié en source fermée. Cependant, vous pouvez l'utiliser librement et sans aucune restriction – pour en savoir plus, cliquez ici.
Trading is my passion.
Clause de non-responsabilité
Les informations et publications ne sont pas destinées à être, et ne constituent pas, des conseils ou recommandations financiers, d'investissement, de trading ou autres fournis ou approuvés par TradingView. Pour en savoir plus, consultez les Conditions d'utilisation.