█ OVERVIEW
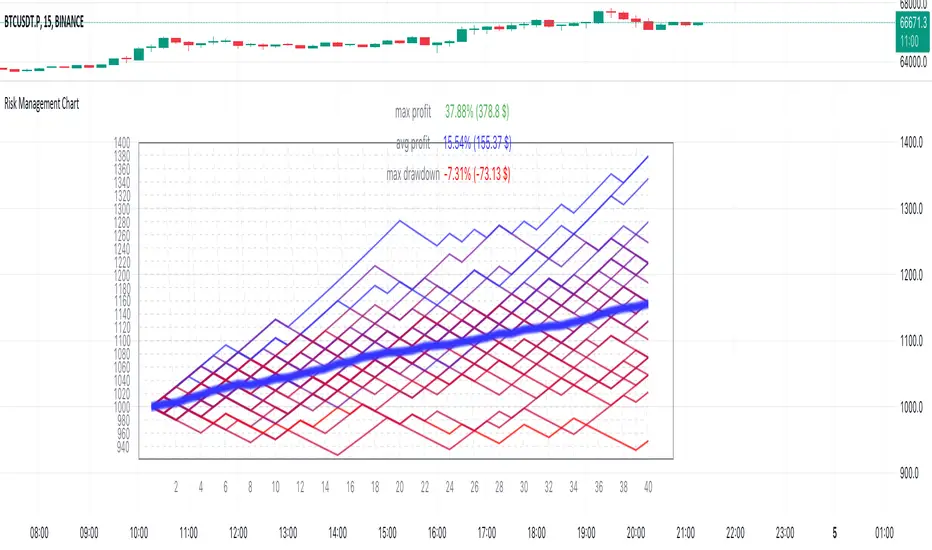
Risk Management Chart allows you to calculate and visualize equity and risk depend on your risk-reward statistics which you can set at the settings.
This script generates random trades and variants of each trade based on your settings of win/loss percent and shows it on the chart as different polyline and also shows thick line which is average of all trades.
It allows you to visualize and possible to analyze probability of your risk management. Be using different settings you can adjust and change your risk management for better profit in future.
It uses compound interest for each trade.
Each variant of trade is shown as a polyline with color from gradient depended on it last profit.
Also I made blurred lines for better visualization with function :
Pine Script®
█ HOW TO USE
Just add it to the cart and expand the window.

█ SETTINGS
Start Equity $ - Amount of money to start with (your equity for trades)
Win Probability % - Percent of your win / loss trades
Risk/Reward Ratio - How many profit you will get for each risk(depends on risk per trade %)
Number of Trades - How many trades will be generated for each variant of random trading
Number of variants(lines) - How many variants will be generated for each trade
Risk per Trade % -risk % of current equity for each trade
If you have any ask it at comments.
Hope it will be useful.
Risk Management Chart allows you to calculate and visualize equity and risk depend on your risk-reward statistics which you can set at the settings.
This script generates random trades and variants of each trade based on your settings of win/loss percent and shows it on the chart as different polyline and also shows thick line which is average of all trades.
It allows you to visualize and possible to analyze probability of your risk management. Be using different settings you can adjust and change your risk management for better profit in future.
It uses compound interest for each trade.
Each variant of trade is shown as a polyline with color from gradient depended on it last profit.
Also I made blurred lines for better visualization with function :
poly(_arr, _col, _t, _tr) =>
for t = 1 to _t
polyline.new(_arr, false, false, xloc.bar_index, color.new(_col, 0 + t * _tr), line_width = t)
█ HOW TO USE
Just add it to the cart and expand the window.
█ SETTINGS
Start Equity $ - Amount of money to start with (your equity for trades)
Win Probability % - Percent of your win / loss trades
Risk/Reward Ratio - How many profit you will get for each risk(depends on risk per trade %)
Number of Trades - How many trades will be generated for each variant of random trading
Number of variants(lines) - How many variants will be generated for each trade
Risk per Trade % -risk % of current equity for each trade
If you have any ask it at comments.
Hope it will be useful.
Script open-source
Dans l'esprit TradingView, le créateur de ce script l'a rendu open source afin que les traders puissent examiner et vérifier ses fonctionnalités. Bravo à l'auteur! Bien que vous puissiez l'utiliser gratuitement, n'oubliez pas que la republication du code est soumise à nos Règles.
Clause de non-responsabilité
Les informations et publications ne sont pas destinées à être, et ne constituent pas, des conseils ou recommandations financiers, d'investissement, de trading ou autres fournis ou approuvés par TradingView. Pour en savoir plus, consultez les Conditions d'utilisation.