OPEN-SOURCE SCRIPT
Mis à jour FlipTracker
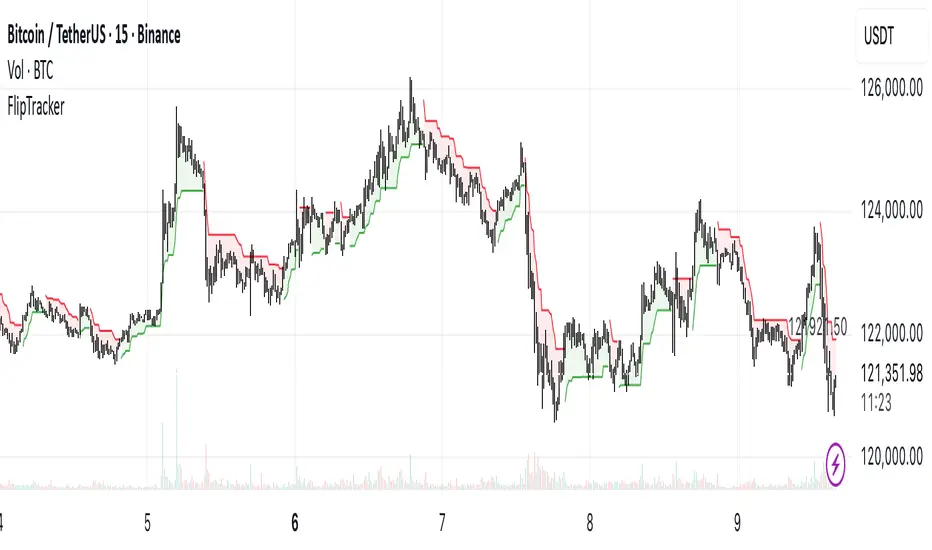
The FlipTracker is calculated using the Average True Range (ATR) to determine the indicator’s sensitivity to market volatility.
It plots a line above or below the price depending on whether the trend is bearish or bullish:
🟩 Bullish Trend – Price closes above the FlipTracker line.
🟥 Bearish Trend – Price closes below the FlipTracker line.
When the direction flips (price crossing the FlipTracker), the indicator changes color and provides a potential trend reversal signal.
Notes de version
FlipTrackerScript open-source
Dans l'esprit de TradingView, le créateur de ce script l'a rendu open-source, afin que les traders puissent examiner et vérifier sa fonctionnalité. Bravo à l'auteur! Vous pouvez l'utiliser gratuitement, mais n'oubliez pas que la republication du code est soumise à nos Règles.
Clause de non-responsabilité
Les informations et les publications ne sont pas destinées à être, et ne constituent pas, des conseils ou des recommandations en matière de finance, d'investissement, de trading ou d'autres types de conseils fournis ou approuvés par TradingView. Pour en savoir plus, consultez les Conditions d'utilisation.
Script open-source
Dans l'esprit de TradingView, le créateur de ce script l'a rendu open-source, afin que les traders puissent examiner et vérifier sa fonctionnalité. Bravo à l'auteur! Vous pouvez l'utiliser gratuitement, mais n'oubliez pas que la republication du code est soumise à nos Règles.
Clause de non-responsabilité
Les informations et les publications ne sont pas destinées à être, et ne constituent pas, des conseils ou des recommandations en matière de finance, d'investissement, de trading ou d'autres types de conseils fournis ou approuvés par TradingView. Pour en savoir plus, consultez les Conditions d'utilisation.