OPEN-SOURCE SCRIPT
Mis à jour Previous Day Levels (High, Low, Open, Close)
This TradingView Pine Script indicator plots the previous day’s price levels (High, Low, Open, and Close) as horizontal rays that extend across the current trading day.
Green lines mark the Previous Day High and Previous Day Low.
Yellow lines mark the Previous Day Open and Previous Day Close.
Labels are automatically displayed at the right edge of the chart, positioned above each line, making it easy to identify the corresponding level in real time.
The levels are updated daily and always begin at the start of the current day, ensuring that they cover the entire intraday session.
This tool helps traders quickly visualize key support and resistance levels from the previous trading day and incorporate them into intraday strategies.
Notes de version
This TradingView Pine Script indicator plots the previous day’s price levels (High, Low, Open, and Close) as horizontal rays that extend across the current trading day.Green lines mark the Previous Day High and Previous Day Low.
Yellow lines mark the Previous Day Open and Previous Day Close.
Labels are automatically displayed at the right edge of the chart, positioned above each line, making it easy to identify the corresponding level in real time.
The levels are updated daily and always begin at the start of the current day, ensuring that they cover the entire intraday session.
This tool helps traders quickly visualize key support and resistance levels from the previous trading day and incorporate them into intraday strategies.
Notes de version
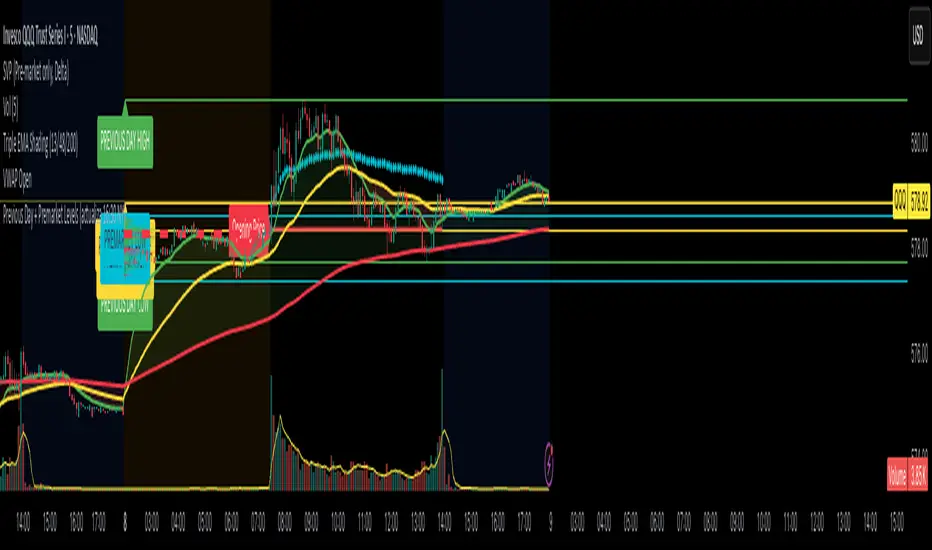
This TradingView Pine Script indicator automatically plots key price levels from the previous trading day and the pre‑market session on intraday charts.Previous Day Levels
High and Low → Green horizontal rays
Open and Close → Yellow horizontal rays
Pre‑Market Levels (04:00 – 09:30 New York time)
High and Low → Aqua (light blue) horizontal rays
All levels extend across the entire current trading day, making them easy to reference during live trading.
Labels are displayed at the beginning of each line, clearly identifying whether the level corresponds to the previous day or the pre‑market session.
This tool helps traders quickly identify and track important support and resistance zones from both the previous day and the pre‑market, which are often respected during regular trading hours.
Notes de version
This indicator automatically plots the key previous day levels and premarket levels on your chart, aligned with New York trading hours.🔹 Main Features
Previous Day Levels
High, Low, Open, and Close.
These levels update right after the regular session ends at 4:30 pm NY, and remain fixed throughout the extended session and the following premarket.
Premarket Levels (04:00–09:30 NY)
Premarket High.
Premarket Low.
Calculated dynamically during premarket trading hours.
Visual Representation
Horizontal lines extended to the right for each level.
Labels attached at the start of each line for clarity (PREVIOUS DAY HIGH, PREMARKET LOW, etc.).
Color-coded lines:
Yellow = Previous Day Open/Close
Green = Previous Day High/Low
Aqua = Premarket High/Low
🔹 Update Logic
From 4:30 pm to 9:29 am NY → "Previous Day" levels are based on the just-closed trading day.
From 9:30 am to 4:29 pm NY → "Previous Day" levels reflect the prior day.
This ensures levels are available immediately after the session close, not delayed until the next day’s market open.
Script open-source
Dans l'esprit TradingView, le créateur de ce script l'a rendu open source afin que les traders puissent examiner et vérifier ses fonctionnalités. Bravo à l'auteur! Bien que vous puissiez l'utiliser gratuitement, n'oubliez pas que la republication du code est soumise à nos Règles.
Clause de non-responsabilité
Les informations et publications ne sont pas destinées à être, et ne constituent pas, des conseils ou recommandations financiers, d'investissement, de trading ou autres fournis ou approuvés par TradingView. Pour en savoir plus, consultez les Conditions d'utilisation.