OPEN-SOURCE SCRIPT
Mis à jour O'Neil Earnings Stability
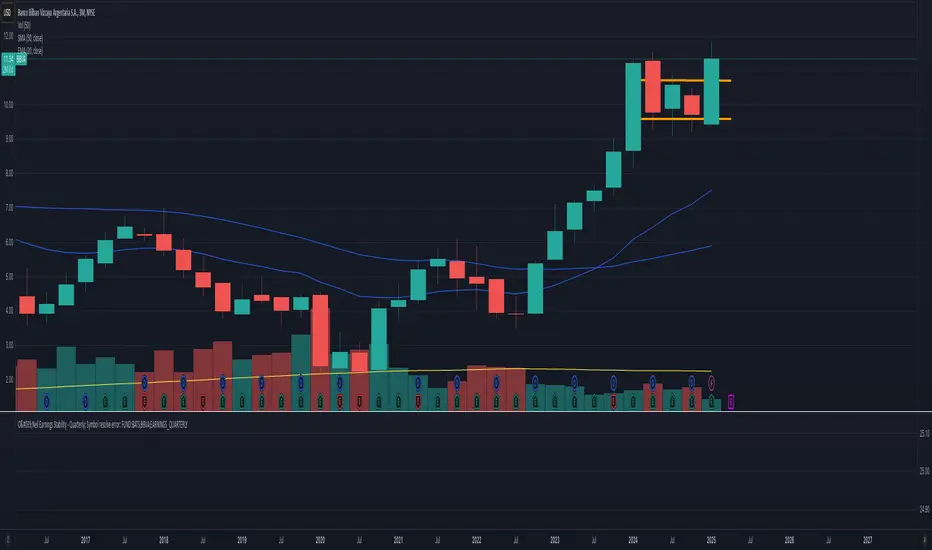
O'Neil Earnings Stability Indicator
This indicator implements William O'Neil's earnings stability analysis, a key factor in identifying high-quality growth stocks. It measures both earnings stability (1-99 scale) and growth rate.
Scale Interpretation:
• 1-25: Highly stable earnings (ideal)
• 26-30: Moderately stable
• >30: More cyclical/less dependable
The stability score is calculated by measuring deviations from the earnings trend line, with lower scores indicating more consistent growth. Combined with the annual growth rate (target ≥25%), this helps identify stocks with both steady and strong earnings growth.
Optimal Criteria:
✓ Stability Score < 25
✓ Annual Growth > 25%
This tool helps filter out stocks with erratic earnings patterns and identify those with proven, sustainable growth records. Green label indicates both criteria are met; red indicates one or both criteria failed."
Would you like me to modify any part of this description or add more details about specific aspects of the calculation?
The key concepts in these calculations:
Stability Score (1-99 scale):
Lower score = more stable
Takes average deviation from mean earnings
Uses logarithmic scaling to emphasize smaller deviations
Multiplies by 20 to get into 1-99 range
Score ≤ 25 meets O'Neil's criteria
Growth Rate:
Year-over-year comparison (current quarter vs same quarter last year)
Calculated as percentage change
Growth ≥ 25% meets O'Neil's criteria
O'Neil's Combined Criteria:
Stability Score should be ≤ 25 (indicating stable earnings)
Growth Rate should be ≥ 25% (indicating strong growth)
Both must be met for ideal conditions
Notes de version
- updating script to stay static with earnings calculations not based on intervals selectedScript open-source
Dans l'esprit TradingView, le créateur de ce script l'a rendu open source afin que les traders puissent examiner et vérifier ses fonctionnalités. Bravo à l'auteur! Bien que vous puissiez l'utiliser gratuitement, n'oubliez pas que la republication du code est soumise à nos Règles.
Clause de non-responsabilité
Les informations et publications ne sont pas destinées à être, et ne constituent pas, des conseils ou recommandations financiers, d'investissement, de trading ou autres fournis ou approuvés par TradingView. Pour en savoir plus, consultez les Conditions d'utilisation.
Script open-source
Dans l'esprit TradingView, le créateur de ce script l'a rendu open source afin que les traders puissent examiner et vérifier ses fonctionnalités. Bravo à l'auteur! Bien que vous puissiez l'utiliser gratuitement, n'oubliez pas que la republication du code est soumise à nos Règles.
Clause de non-responsabilité
Les informations et publications ne sont pas destinées à être, et ne constituent pas, des conseils ou recommandations financiers, d'investissement, de trading ou autres fournis ou approuvés par TradingView. Pour en savoir plus, consultez les Conditions d'utilisation.