PROTECTED SOURCE SCRIPT
10Y - 2Y Spread (Farbig)
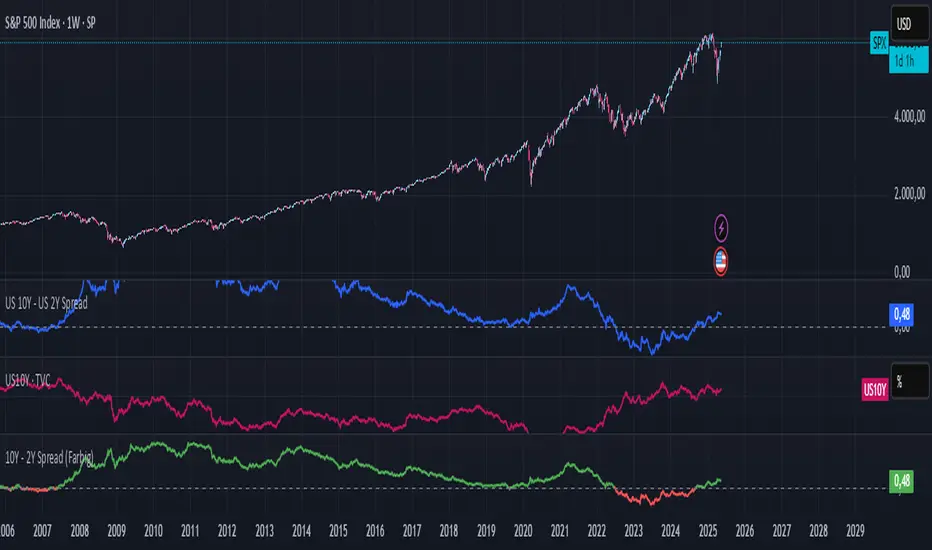
10Y – 2Y Yield Spread (Color-Coded)
Description:
This indicator plots the yield spread between the US 10-Year and 2-Year Treasury yields (US10Y – US02Y) as a color-coded line:
Green = normal yield curve (positive spread)
Red = inverted yield curve (negative spread), often seen as a leading recession signal
A horizontal zero line is added to highlight turning points.
This indicator is ideal for tracking macroeconomic yield curve behavior and can be used alongside equity, crypto, or commodity charts.
Script protégé
Ce script est publié en source fermée. Cependant, vous pouvez l'utiliser librement et sans aucune restriction – pour en savoir plus, cliquez ici.
Clause de non-responsabilité
Les informations et publications ne sont pas destinées à être, et ne constituent pas, des conseils ou recommandations financiers, d'investissement, de trading ou autres fournis ou approuvés par TradingView. Pour en savoir plus, consultez les Conditions d'utilisation.