OPEN-SOURCE SCRIPT
Mis à jour Indices Tracker and VOLD-Market Breadth

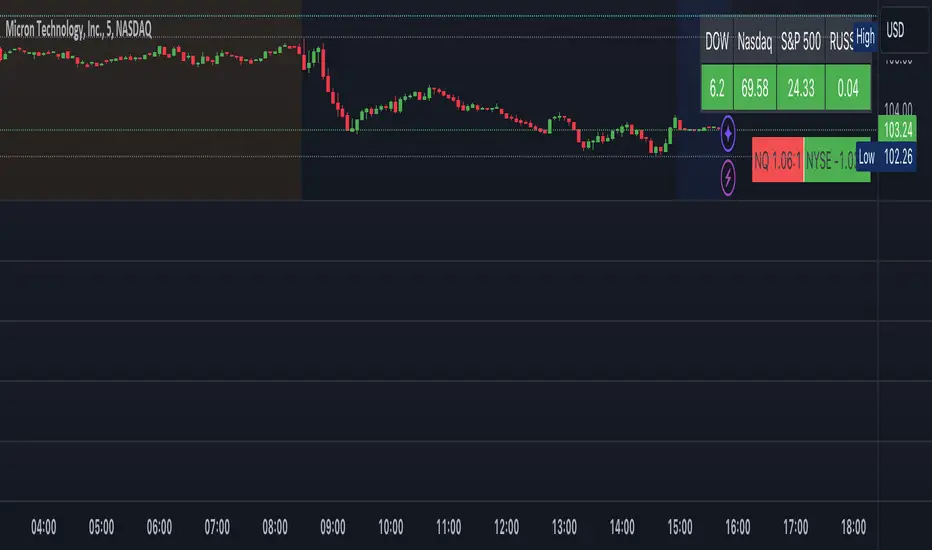
This is an overlay displaying DOW, Nasdaq and S&P performance for the day in real-time along with NQ and NYSE market breadth display.
Overview of the Script:
The Dow, Nasdaq, S&P Tracker section is at the top, displaying the current index values, changes, and colors.
The VOLD-Market Breadth section is below, providing the market breadth information.
Helpful to get a market view while trading stocks or options directionally.
Overview of the Script:
The Dow, Nasdaq, S&P Tracker section is at the top, displaying the current index values, changes, and colors.
The VOLD-Market Breadth section is below, providing the market breadth information.
Helpful to get a market view while trading stocks or options directionally.
Notes de version
Basic script overlaying US market indices (Dow, Nasdaq, S&P and Russel) on the chart along with market breadth information of NQ and NYSE.Ready reference while exploring other stocks for trading.
Script open-source
Dans l'esprit TradingView, le créateur de ce script l'a rendu open source afin que les traders puissent examiner et vérifier ses fonctionnalités. Bravo à l'auteur! Bien que vous puissiez l'utiliser gratuitement, n'oubliez pas que la republication du code est soumise à nos Règles.
Clause de non-responsabilité
Les informations et publications ne sont pas destinées à être, et ne constituent pas, des conseils ou recommandations financiers, d'investissement, de trading ou autres fournis ou approuvés par TradingView. Pour en savoir plus, consultez les Conditions d'utilisation.