OPEN-SOURCE SCRIPT
Taiwan Pagoda Chart (Triple)
The code is open-source.
======================
Indicator Name
Taiwan Pagoda Chart
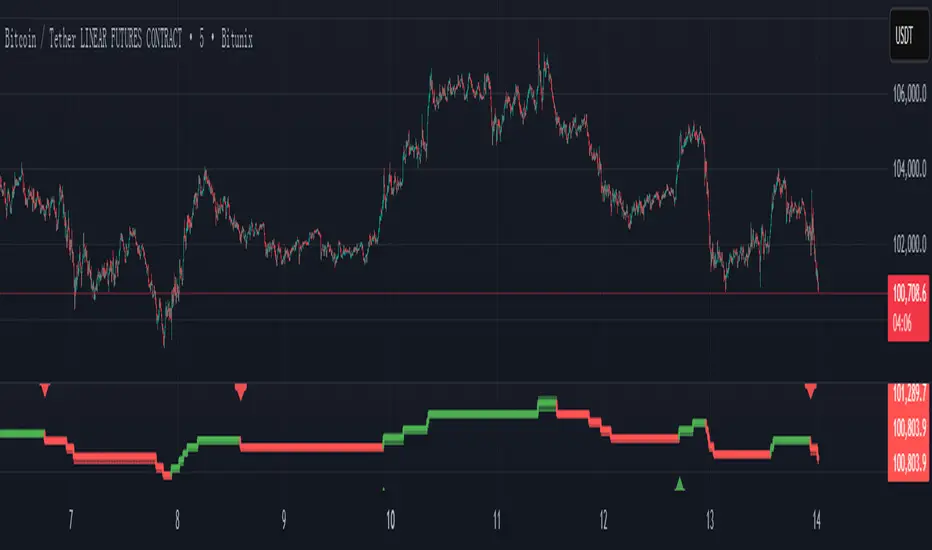
This is a technical analysis charting method similar to candlesticks but with different logic, designed to filter market noise and identify trend reversal points.
Key Features
Dynamic Pagoda Line Plotting
Unlike traditional candlesticks that plot every bar, the Pagoda line only updates when the price breaks above the previous high or below the previous low by a certain threshold.
Bullish (rising) bars are shown in green; bearish (falling) bars in red.
Multiple Optional Filters
T-value filter: Sets a minimum price change threshold to avoid signals from minor fluctuations.
Price percentage filter: Dynamically adjusts sensitivity based on a percentage of the previous Pagoda bar’s range.
ATR volatility filter: Uses Average True Range (ATR) to widen the threshold during high volatility and tighten it during low volatility.
Visual Design
Semi-transparent Pagoda structure for better visual context.
A bold central trend line to clearly show the underlying market direction.
Trading Signal Alerts
Bullish reversal (turning green): Potential buy signal.
Bearish reversal (turning red): Potential sell signal.
Optional on-chart labels (B / S) and support for TradingView alert notifications.
Highly Customizable
Users can freely adjust colors, line width, filtering rules, and signal visibility—making it adaptable to various trading styles.
Ideal Use Cases
Trend following
Reducing false breakouts
Helping medium-to-long-term traders identify high-probability entry and exit points
======================
Indicator Name
Taiwan Pagoda Chart
This is a technical analysis charting method similar to candlesticks but with different logic, designed to filter market noise and identify trend reversal points.
Key Features
Dynamic Pagoda Line Plotting
Unlike traditional candlesticks that plot every bar, the Pagoda line only updates when the price breaks above the previous high or below the previous low by a certain threshold.
Bullish (rising) bars are shown in green; bearish (falling) bars in red.
Multiple Optional Filters
T-value filter: Sets a minimum price change threshold to avoid signals from minor fluctuations.
Price percentage filter: Dynamically adjusts sensitivity based on a percentage of the previous Pagoda bar’s range.
ATR volatility filter: Uses Average True Range (ATR) to widen the threshold during high volatility and tighten it during low volatility.
Visual Design
Semi-transparent Pagoda structure for better visual context.
A bold central trend line to clearly show the underlying market direction.
Trading Signal Alerts
Bullish reversal (turning green): Potential buy signal.
Bearish reversal (turning red): Potential sell signal.
Optional on-chart labels (B / S) and support for TradingView alert notifications.
Highly Customizable
Users can freely adjust colors, line width, filtering rules, and signal visibility—making it adaptable to various trading styles.
Ideal Use Cases
Trend following
Reducing false breakouts
Helping medium-to-long-term traders identify high-probability entry and exit points
Script open-source
Dans l'esprit TradingView, le créateur de ce script l'a rendu open source afin que les traders puissent examiner et vérifier ses fonctionnalités. Bravo à l'auteur! Bien que vous puissiez l'utiliser gratuitement, n'oubliez pas que la republication du code est soumise à nos Règles.
Clause de non-responsabilité
Les informations et publications ne sont pas destinées à être, et ne constituent pas, des conseils ou recommandations financiers, d'investissement, de trading ou autres fournis ou approuvés par TradingView. Pour en savoir plus, consultez les Conditions d'utilisation.