OPEN-SOURCE SCRIPT
RSI Scanner
RSI Scanner
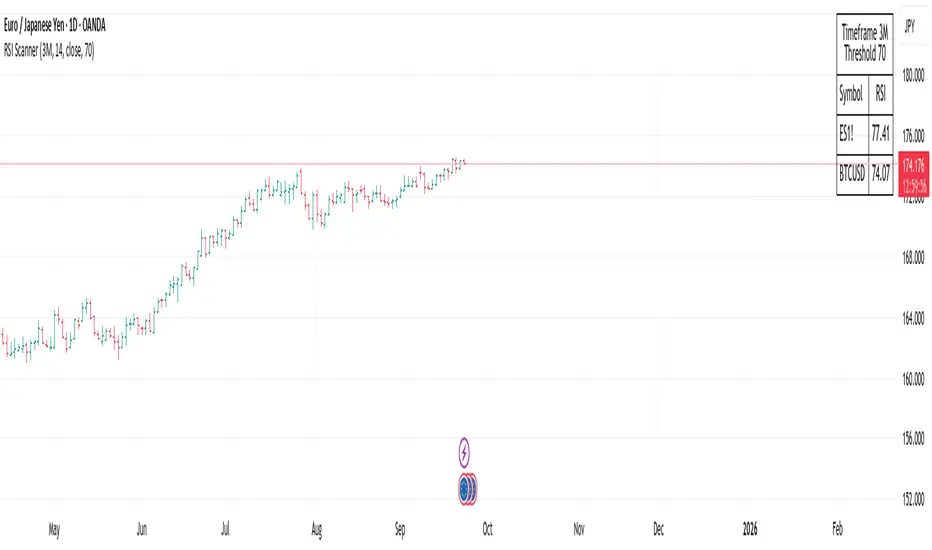
This script scans a custom list of symbols and displays their RSI values for a selected higher timeframe (default: 3M). It provides a quick way to monitor multiple markets in one place without switching charts.
Features:
How to use:
Use cases:
This script scans a custom list of symbols and displays their RSI values for a selected higher timeframe (default: 3M). It provides a quick way to monitor multiple markets in one place without switching charts.
Features:
- Customizable timeframe for RSI calculation (default: 3M).
- Adjustable RSI length and source input.
- Flexible filter: display all symbols or only those with RSI above a chosen threshold.
- Input your own list of symbols (stocks, forex, futures, crypto) via a text field.
- Results displayed in a clean, table directly on the chart.
- Automatic column split when the symbol list is long.
- Table header shows selected timeframe and filter settings for clarity.
How to use:
- Add the script to your chart.
- Open the Inputs panel.
- In Symbols List, enter the tickers you want to track, separated by commas (e.g. AAPL, TSLA, EURUSD, BTCUSD).
- Set the desired Timeframe (e.g. 3M, 1M, W).
- Adjust RSI Length and Source if needed.
- Enable or disable filtering:
If filtering is enabled, only symbols with RSI ≥ the threshold will be shown.
If disabled, all entered symbols will be displayed. - The table in the top-right corner will update automatically on the last bar.
Use cases:
- Monitor RSI across different asset classes on higher timeframes.
- Quickly spot overbought symbols (e.g. RSI > 70) without switching charts.
- Create a custom multi-market watchlist tailored to your strategy.
Script open-source
Dans l'esprit TradingView, le créateur de ce script l'a rendu open source afin que les traders puissent examiner et vérifier ses fonctionnalités. Bravo à l'auteur! Bien que vous puissiez l'utiliser gratuitement, n'oubliez pas que la republication du code est soumise à nos Règles.
Clause de non-responsabilité
Les informations et publications ne sont pas destinées à être, et ne constituent pas, des conseils ou recommandations financiers, d'investissement, de trading ou autres fournis ou approuvés par TradingView. Pour en savoir plus, consultez les Conditions d'utilisation.