OPEN-SOURCE SCRIPT
Correlation Zones
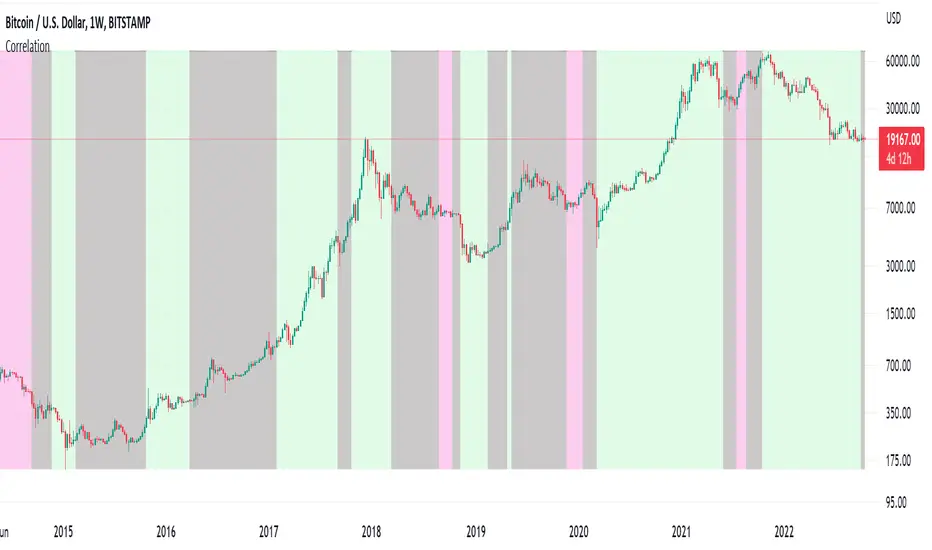
This indicator highlights zones with strong, weak and negative correlation. Unlike standard coefficient indicator it will help to filter out noise when analyzing dependencies between two assets.
With default input setting Correlation_Threshold=0.5:
- Zones with correlation above 0.5, will be colored in green (strong correlation)
- Zones with correlation from -0.5 to 0.5 will be colored grey (weak correlation)
- Zones with correlation below -0.5 will be colore red (strong negative correlation)
Input parameter "Correlation_Threshold" can be modified in settings.
Provided example demonstrates BTCUSD correlation with NASDAQ Composite . I advice to use weekly timeframe and set length to 26 week for this study
Script open-source
Dans l'esprit TradingView, le créateur de ce script l'a rendu open source afin que les traders puissent examiner et vérifier ses fonctionnalités. Bravo à l'auteur! Bien que vous puissiez l'utiliser gratuitement, n'oubliez pas que la republication du code est soumise à nos Règles.
Clause de non-responsabilité
Les informations et publications ne sont pas destinées à être, et ne constituent pas, des conseils ou recommandations financiers, d'investissement, de trading ou autres fournis ou approuvés par TradingView. Pour en savoir plus, consultez les Conditions d'utilisation.