OPEN-SOURCE SCRIPT
Mis à jour Risk Context + Position Sizing
What This Indicator Does (And Doesn't Do)
This is NOT a buy/sell signal indicator. Instead, it's a risk management tool that helps you understand two critical things:
The Core Problem It Solves
Imagine you always risk the same amount on every trade - say $100. But sometimes the market is calm and predictable, other times it's wild and unpredictable. This indicator says: "Hey, the market is going crazy right now - maybe only risk $70 instead of your usual $100."
How It Works
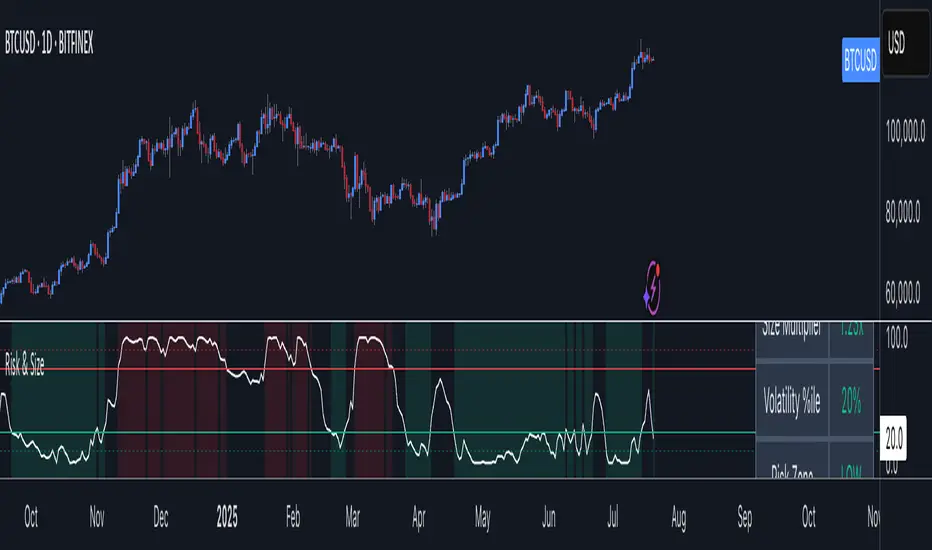
Measures Market "Nervousness"
Categorizes Risk Environment
Important Disclaimers
This is NOT a buy/sell signal indicator. Instead, it's a risk management tool that helps you understand two critical things:
- How volatile the market is right now (compared to recent history)
- How much you should risk on your next trade based on that volatility
The Core Problem It Solves
Imagine you always risk the same amount on every trade - say $100. But sometimes the market is calm and predictable, other times it's wild and unpredictable. This indicator says: "Hey, the market is going crazy right now - maybe only risk $70 instead of your usual $100."
How It Works
Measures Market "Nervousness"
- Uses ATR (Average True Range) to measure how much prices typically move each day
- Compares today's volatility to the past 100 days
- Shows you a percentile (0-100%) - higher = more volatile
Categorizes Risk Environment
- LOW (green): Market is calm, you can size up slightly
- NORMAL: Standard conditions, use your normal position size
- HIGH (red): Market is jumpy, reduce your position size
- EXTREME (dark red): Market is in chaos, significantly reduce size
Important Disclaimers
- This doesn't predict price direction - it only measures current market stress
- You still need a trading strategy - this just helps you size it properly
- Past volatility doesn't guarantee future volatility
- Always combine with proper stop losses and risk management
Notes de version
Improved position sizing logic by replacing step-based scaling with a smoother volatility-adjusted model. This enhances risk calibration and responsiveness to market conditions.Script open-source
Dans l'esprit TradingView, le créateur de ce script l'a rendu open source afin que les traders puissent examiner et vérifier ses fonctionnalités. Bravo à l'auteur! Bien que vous puissiez l'utiliser gratuitement, n'oubliez pas que la republication du code est soumise à nos Règles.
Clause de non-responsabilité
Les informations et publications ne sont pas destinées à être, et ne constituent pas, des conseils ou recommandations financiers, d'investissement, de trading ou autres fournis ou approuvés par TradingView. Pour en savoir plus, consultez les Conditions d'utilisation.
Script open-source
Dans l'esprit TradingView, le créateur de ce script l'a rendu open source afin que les traders puissent examiner et vérifier ses fonctionnalités. Bravo à l'auteur! Bien que vous puissiez l'utiliser gratuitement, n'oubliez pas que la republication du code est soumise à nos Règles.
Clause de non-responsabilité
Les informations et publications ne sont pas destinées à être, et ne constituent pas, des conseils ou recommandations financiers, d'investissement, de trading ou autres fournis ou approuvés par TradingView. Pour en savoir plus, consultez les Conditions d'utilisation.