OPEN-SOURCE SCRIPT
TOTAL:(RSI+TSI)
TOTAL:(RSI+TSI)
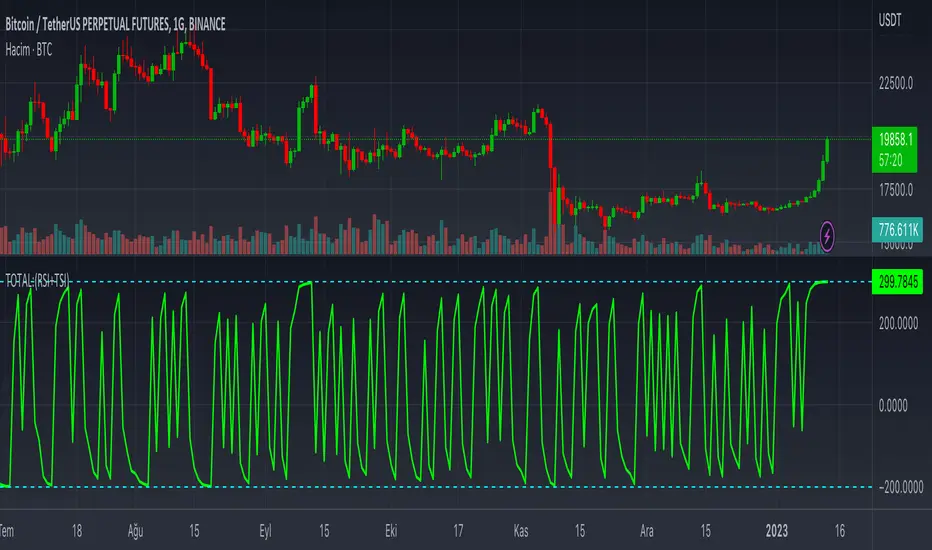
This indicator collects instant data of RSI and TSI oscillators. RSI moves between (0) and (100) values as a moving line, while TSI moves between (-100) and (+100) values as two moving lines.
The top value of the sum of these values is graphically;
It takes the total value (+300) from RSI (+100), TSI (+100) and (+100).
The lowest value of the sum of these values is graphically;
It takes the value (-200) from the RSI (0), (-100) and (-100) from the TSI.
In case this indicator approaches (+300) graphically; It can be seen that price candlesticks mostly move upwards. This may not always give accurate results. Past incompatibilities can affect this situation.
In case this indicator approaches (-200) graphically; It can be seen that price candlesticks mostly move downwards. This may not always give accurate results. Past incompatibilities can affect this situation.
The graphical movements and numerical values created by this indicator do not give precise results for price candles.
Script open-source
Dans l'esprit TradingView, le créateur de ce script l'a rendu open source afin que les traders puissent examiner et vérifier ses fonctionnalités. Bravo à l'auteur! Bien que vous puissiez l'utiliser gratuitement, n'oubliez pas que la republication du code est soumise à nos Règles.
Clause de non-responsabilité
Les informations et publications ne sont pas destinées à être, et ne constituent pas, des conseils ou recommandations financiers, d'investissement, de trading ou autres fournis ou approuvés par TradingView. Pour en savoir plus, consultez les Conditions d'utilisation.