OPEN-SOURCE SCRIPT
Mis à jour Bitcoin Fair Price Calculator [bitcoinfairprice.com]
1. Purpose of the scriptLong-term Bitcoin valuation based on historical time (days since Genesis block)
Fair Price = theoretically “fair” price according to power law.
Bottom Price = lower support (historically ~58% below Fair Price).
Daily display as on the website – without external access.
Buy/sell signals in case of strong overvaluation/undervaluation.
2. Mathematical model (original formula)pinescript
Bottom Price = Fair Price × 0.42
→ Corresponds historically to ~58% below Fair Price.
Days since Genesis block are calculated automatically per bar.
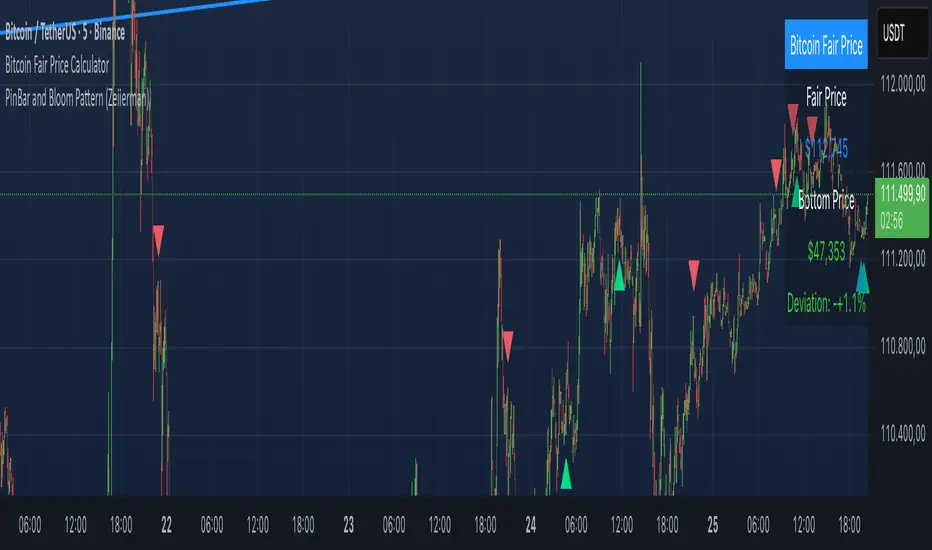
3. What is displayed in the chart?
Fair Price Average power law line (“fair price”) Blue
Bottom Price Lower support (“floor”) Green
Power Law Corridor Filled area between 0.1× and 2.5× Fair Price Light blue (transparent)
Table (top right) Daily values as on the website Black with white text
Label (for >20% deviation) Shows current prices + percentage Red (overvalued) / Green (undervalued)
4. Recommended use Timeframe
Recommendation Weekly / Monthly Best long-term signals
Daily Good balance
Log scale Be sure to activate! (Right-click on Y-axis → “Logarithmic scale”)
9. Strategy tips (based on the model)
Price near bottom --> Buy / accumulate
Price > 2.5× fair price --> Sell part of position / caution
Price between fair & bottom --> Strong buy zone
Deviation < -20% --> HODL signal
Translated with DeepL.com (free version)
Fair Price = theoretically “fair” price according to power law.
Bottom Price = lower support (historically ~58% below Fair Price).
Daily display as on the website – without external access.
Buy/sell signals in case of strong overvaluation/undervaluation.
2. Mathematical model (original formula)pinescript
Bottom Price = Fair Price × 0.42
→ Corresponds historically to ~58% below Fair Price.
Days since Genesis block are calculated automatically per bar.
3. What is displayed in the chart?
Fair Price Average power law line (“fair price”) Blue
Bottom Price Lower support (“floor”) Green
Power Law Corridor Filled area between 0.1× and 2.5× Fair Price Light blue (transparent)
Table (top right) Daily values as on the website Black with white text
Label (for >20% deviation) Shows current prices + percentage Red (overvalued) / Green (undervalued)
4. Recommended use Timeframe
Recommendation Weekly / Monthly Best long-term signals
Daily Good balance
Log scale Be sure to activate! (Right-click on Y-axis → “Logarithmic scale”)
9. Strategy tips (based on the model)
Price near bottom --> Buy / accumulate
Price > 2.5× fair price --> Sell part of position / caution
Price between fair & bottom --> Strong buy zone
Deviation < -20% --> HODL signal
Translated with DeepL.com (free version)
Notes de version
1. Purpose of the scriptLong-term Bitcoin valuation based on historical time (days since Genesis block)Fair Price = theoretically “fair” price according to power law.
Bottom Price = lower support (historically ~58% below Fair Price).
Daily display as on the website – without external access.
Buy/sell signals in case of strong overvaluation/undervaluation.
2. Mathematical model (original formula)pinescript
Bottom Price = Fair Price × 0.42
→ Corresponds historically to ~58% below Fair Price.
Days since Genesis block are calculated automatically per bar.
3. What is displayed in the chart?
Fair Price Average power law line (“fair price”) Blue
Bottom Price Lower support (“floor”) Green
Power Law Corridor Filled area between 0.1× and 2.5× Fair Price Light blue (transparent)
Table (top right) Daily values as on the website Black with white text
Label (for >20% deviation) Shows current prices + percentage Red (overvalued) / Green (undervalued)
4. Recommended use Timeframe
Recommendation Weekly / Monthly Best long-term signals
Daily Good balance
Log scale Be sure to activate! (Right-click on Y-axis → “Logarithmic scale”)
5. Strategy tips (based on the model)
Price near bottom --> Buy / accumulate
Price > 2.5× fair price --> Sell part of position / caution
Price between fair & bottom --> Strong buy zone
Deviation < -20% --> HODL signal
Script open-source
Dans l'esprit de TradingView, le créateur de ce script l'a rendu open-source, afin que les traders puissent examiner et vérifier sa fonctionnalité. Bravo à l'auteur! Vous pouvez l'utiliser gratuitement, mais n'oubliez pas que la republication du code est soumise à nos Règles.
Clause de non-responsabilité
Les informations et les publications ne sont pas destinées à être, et ne constituent pas, des conseils ou des recommandations en matière de finance, d'investissement, de trading ou d'autres types de conseils fournis ou approuvés par TradingView. Pour en savoir plus, consultez les Conditions d'utilisation.