PROTECTED SOURCE SCRIPT
PpSignal Renko
A renko chart is a type of financial chart of Japanese origin used in technical analysis that measures and plots price changes. A renko chart consists of bricks, which proponents say more clearly show market trends and increase the signal-to-noise ratio compared to typical candlestick charts
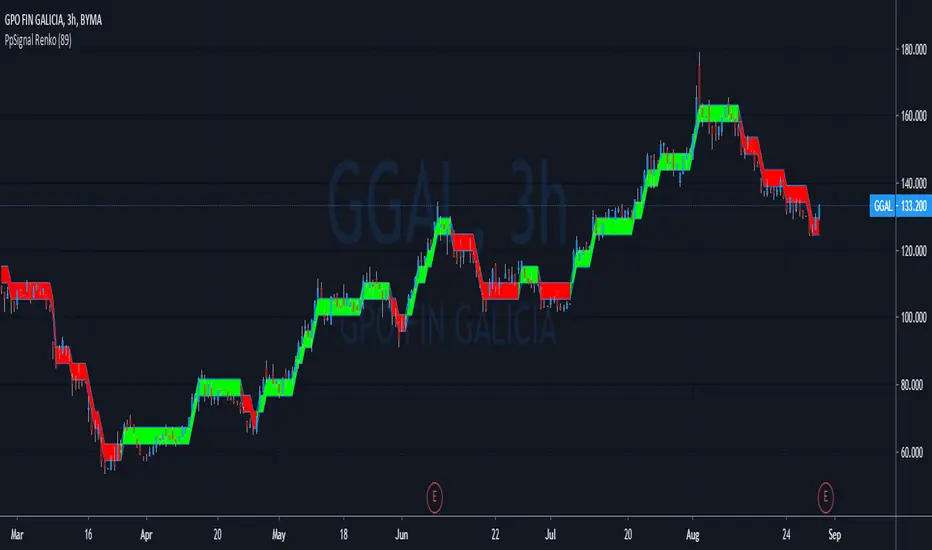
PpSignal Renko emulator you can see the Renko chart and the candle in the same time.
Work with atr Average true range.
Buy when the Renko is lime end sell when the Renko is red.
Be careful the Renko chart changes color when the close Renko price is higher than the open Renko so it can repaint up to the close price of the current candle
Script protégé
Ce script est publié en source fermée. Toutefois, vous pouvez l'utiliser librement et sans aucune restriction - en savoir plus ici.
Clause de non-responsabilité
Les informations et les publications ne sont pas destinées à être, et ne constituent pas, des conseils ou des recommandations en matière de finance, d'investissement, de trading ou d'autres types de conseils fournis ou approuvés par TradingView. Pour en savoir plus, consultez les Conditions d'utilisation.