OPEN-SOURCE SCRIPT
Mis à jour Multi-Timeframe EMAs
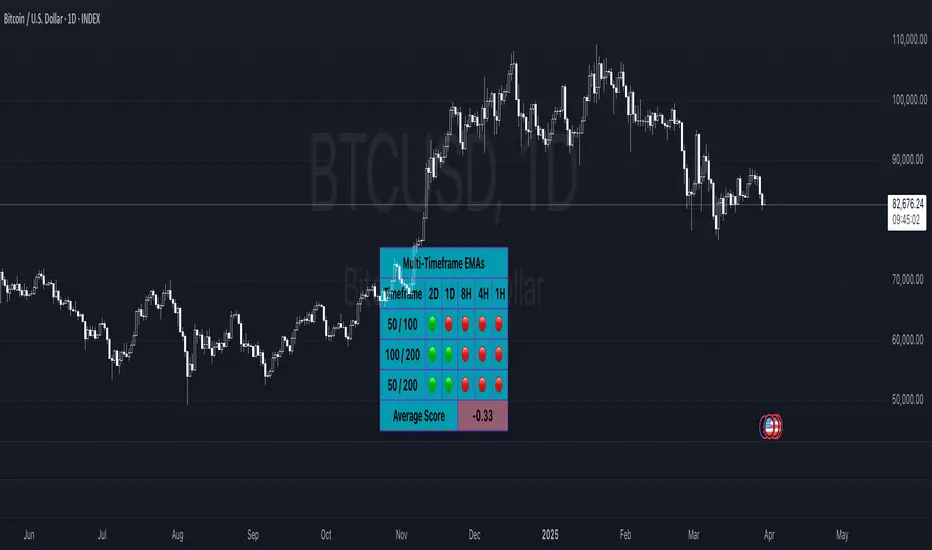
Multi Timeframe EMA's
The 'Multi-Timeframe EMA Band Comparison' indicator is a tool designed to analyze trend direction across multiple timeframes using Exponential Moving Averages. it calculates the 50, 100, and 200 period EMAs for fiver user defined timeframes and compares their relationships to provide a visual snapshot of bullish or bearish momentum.
How it Works:
Average Score:
An overall average score is calculated across all 15 comparisons ranging from 1 to -1, displayed with two decimal places and color coded.
Customization:
This indicator is fully customizable from the timeframe setting to the color of the table. The only specific part that is not changeable is the EMA bands.
The 'Multi-Timeframe EMA Band Comparison' indicator is a tool designed to analyze trend direction across multiple timeframes using Exponential Moving Averages. it calculates the 50, 100, and 200 period EMAs for fiver user defined timeframes and compares their relationships to provide a visual snapshot of bullish or bearish momentum.
How it Works:
- EMA Calculations: For each selected timeframe, the indicator computes the 50, 100, and 200 period EMAs based on the closing price.
- Band Comparisons: Three key relationships are evaluated:
- 50 EMA vs 100 EMA
- 100 EMA vs 200 EMA
- 50 EMA vs 200 EMA
- Scoring System: Each comparison is assigned a score:
- 🟢 (Green Circle): The shorter EMA is above the longer EMA, signaling bullish momentum.
- 🔴 (Red Circle): The shorter EMA is below the longer EMA, signaling bearish momentum.
- ⚪️ (White Circle): The EMAs are equal or data is unavailable (rare).
Average Score:
An overall average score is calculated across all 15 comparisons ranging from 1 to -1, displayed with two decimal places and color coded.
Customization:
This indicator is fully customizable from the timeframe setting to the color of the table. The only specific part that is not changeable is the EMA bands.
Notes de version
Dynamic Inputs for the lengths have been added. Notes de version
- Updated boolean to show EMA lengths for selected lengthsScript open-source
Dans l'esprit TradingView, le créateur de ce script l'a rendu open source afin que les traders puissent examiner et vérifier ses fonctionnalités. Bravo à l'auteur! Bien que vous puissiez l'utiliser gratuitement, n'oubliez pas que la republication du code est soumise à nos Règles.
Clause de non-responsabilité
Les informations et publications ne sont pas destinées à être, et ne constituent pas, des conseils ou recommandations financiers, d'investissement, de trading ou autres fournis ou approuvés par TradingView. Pour en savoir plus, consultez les Conditions d'utilisation.
Script open-source
Dans l'esprit TradingView, le créateur de ce script l'a rendu open source afin que les traders puissent examiner et vérifier ses fonctionnalités. Bravo à l'auteur! Bien que vous puissiez l'utiliser gratuitement, n'oubliez pas que la republication du code est soumise à nos Règles.
Clause de non-responsabilité
Les informations et publications ne sont pas destinées à être, et ne constituent pas, des conseils ou recommandations financiers, d'investissement, de trading ou autres fournis ou approuvés par TradingView. Pour en savoir plus, consultez les Conditions d'utilisation.