OPEN-SOURCE SCRIPT
Sharpe Ratio Indicator (180)
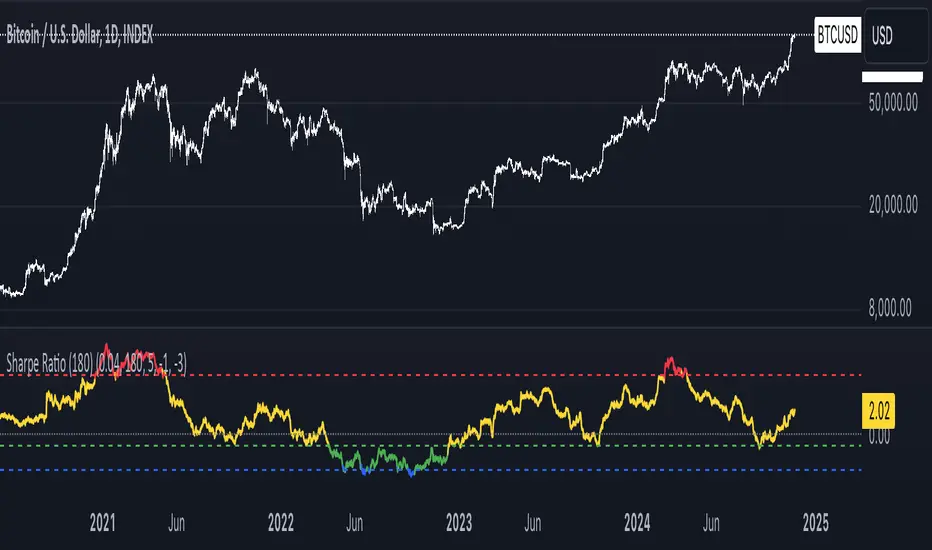
Meant to be used on the 1D chart and on BTC.
The Sharpe Ratio Indicator (180 days) is a tool for evaluating risk-adjusted returns, designed for investors who want to assess whether BTC is overvalued, undervalued, or in a neutral state. It plots the Sharpe Ratio over the past 180 days, color-coded to indicate valuation states:
- Red: Overvalued (Sharpe Ratio > 5).
- Green: Undervalued (Sharpe Ratio < -1).
-Blue: Critically Undervalued (Sharpe Ratio <-3).
- Yellow: Neutral (between -1 and 5).
Note that you can change those values yourself in the settings of the indicator.
Strengths:
- Real-time feedback on risk-adjusted returns helps in making timely investment decisions.
- Color-coded signals (red, green, blue and yellow) provide an intuitive, visual indication of the asset's valuation.
- Flexible: Easily adjustable to different subjective valuation levels and risk-free rates.
All hail to Professor Adam and The Real World Community!
Script open-source
Dans l'esprit TradingView, le créateur de ce script l'a rendu open source afin que les traders puissent examiner et vérifier ses fonctionnalités. Bravo à l'auteur! Bien que vous puissiez l'utiliser gratuitement, n'oubliez pas que la republication du code est soumise à nos Règles.
Clause de non-responsabilité
Les informations et publications ne sont pas destinées à être, et ne constituent pas, des conseils ou recommandations financiers, d'investissement, de trading ou autres fournis ou approuvés par TradingView. Pour en savoir plus, consultez les Conditions d'utilisation.