PROTECTED SOURCE SCRIPT
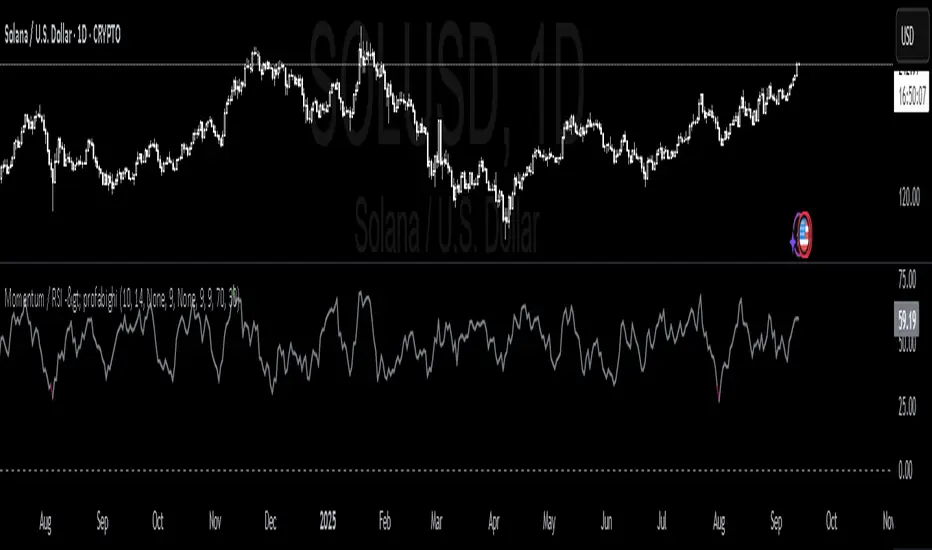
Momentum / RSI -> PROFABIGHI_CAPITAL
🌟 Overview
This Momentum / RSI → PROFABIGHI_CAPITAL implements an innovative dual-indicator system combining momentum calculation with RSI analysis for enhanced market acceleration and deceleration detection.
It provides Momentum-based RSI calculation applying oscillator analysis to momentum values rather than direct price, Dual-display toggle system enabling switching between momentum and smoothed RSI visualization, Advanced multi-method smoothing with nine moving average options for RSI refinement, and Conditional visualization framework with context-appropriate reference lines and threshold levels for comprehensive momentum oscillator analysis.
🔧 Innovative Momentum-RSI Architecture
Professional momentum oscillator framework calculating price momentum and applying RSI analysis for enhanced acceleration detection
Momentum Period Configuration providing adjustable lookback period for momentum calculation balancing sensitivity versus stability
RSI-on-Momentum Implementation applying Relative Strength Index calculation to momentum values rather than direct price for unique market insight
RSI Length Management offering configurable RSI calculation period for momentum oscillator responsiveness adjustment
Display Mode Selection enabling toggle between momentum visualization and smoothed RSI display for flexible analysis approach
Extreme Level Configuration supporting custom overbought and oversold thresholds for momentum-based RSI signals
📊 Advanced Dual-Smoothing Framework
Nine Smoothing Methods supporting SMA, EMA, WMA, HMA, RMA, LSMA, DEMA, TEMA, and VIDYA for comprehensive momentum-RSI refinement
Primary Smoothing Layer providing first-level momentum-RSI smoothing with configurable method selection and period adjustment
Secondary Smoothing Integration enabling additional smoothing layer with independent method and period configuration for enhanced signal clarity
VIDYA Volatility Adaptation implementing Variable Index Dynamic Average with volatility-based smoothing adjustment for market condition responsiveness
Advanced MA Calculations including DEMA and TEMA implementations for reduced lag and improved momentum signal quality
Comparison Mode Activation supporting dual-line analysis with crossover detection between different smoothing configurations
⚙️ Mathematical Implementation Framework
Momentum Calculation Engine using Pine Script momentum function for accurate price acceleration measurement over specified periods
RSI-on-Momentum Formula applying standard RSI calculation methodology to momentum values for oscillator-based acceleration analysis
VIDYA Implementation calculating volatility-adjusted smoothing factor with mathematical precision and boundary constraint management
DEMA Mathematical Framework implementing double exponential moving average with lag reduction for responsive momentum-RSI smoothing
TEMA Advanced Calculation using triple exponential moving average formulation for enhanced smoothing with minimal signal delay
Null Value Protection ensuring continuous calculation through proper handling of undefined values and mathematical edge cases
🔄 Dual-Display System Architecture
Mode Toggle Implementation providing seamless switching between momentum display and smoothed momentum-RSI visualization
Momentum Visualization Mode displaying raw momentum values with positive/negative color coding for immediate acceleration direction identification
RSI Visualization Mode showing smoothed momentum-RSI values with extreme level color coding for overbought/oversold condition detection
Conditional Plotting Logic ensuring only relevant indicators are displayed based on selected visualization mode for clean chart presentation
Context-Appropriate Reference Lines displaying zero line for momentum mode and RSI levels for oscillator mode automatically
Synchronized Color Systems maintaining consistent color schemes across different display modes for intuitive analysis
📈 Enhanced Signal Generation Logic
Momentum Direction Signals using green/red color coding for positive and negative momentum values indicating market acceleration direction
Extreme Level Detection identifying overbought conditions above extreme high threshold and oversold conditions below extreme low threshold
Dual-Smoothing Comparison generating crossover signals when first smoothed momentum-RSI crosses above or below second smoothed line
Color-Coded Momentum-RSI States displaying dark green for extreme overbought, dark red for extreme oversold, and gray for neutral zones
Crossover Signal Generation providing visual confirmation of momentum-RSI line intersections for enhanced signal validation
Signal Persistence Framework maintaining color states until opposing conditions develop for clear trend identification
🎨 Conditional Visualization Framework[/b>
Mode-Specific Reference Lines displaying zero line only during momentum mode and RSI threshold lines only during oscillator mode
Dynamic Color Assignment adapting line colors based on current indicator values and selected visualization mode
Momentum Zero Line showing horizontal reference at zero level with dashed styling for momentum direction assessment
RSI Threshold Lines displaying extreme high, extreme low, and middle reference levels with appropriate transparency
Comparison Mode Synchronization coordinating dual-line colors when secondary smoothing comparison is enabled
[b>Background Raw RSI Display optionally showing unsmoothed momentum-RSI when smoothing is applied for reference comparison
⚡ Performance Optimization Features[/b>
Conditional Computation calculating smoothed values only when RSI display mode is selected for computational efficiency
Efficient MA Switching using optimized switch statements for moving average method selection with minimal processing overhead
Memory Management implementing efficient variable usage and calculation sequences for real-time performance
Real-Time Updates providing immediate momentum and momentum-RSI values with dynamic color changes
[b>Error Prevention Framework incorporating validation and fallback mechanisms for reliable indicator operation across market conditions
Null Value Handling ensuring continuous calculation through proper mathematical validation and edge case management
🔍 Advanced Analysis Applications
Momentum Acceleration Detection identifying periods of increasing or decreasing price acceleration through momentum-RSI oscillator behavior
Divergence Analysis Opportunities comparing price action with momentum-RSI for potential reversal signal identification
Overbought/Oversold Momentum detecting extreme momentum conditions using RSI methodology for enhanced timing precision
[b>Crossover Strategy Implementation utilizing dual-smoothing crossovers for momentum-based entry and exit signal generation
Market Phase Identification[/b> recognizing acceleration, deceleration, and consolidation phases through momentum-RSI analysis
Multi-Timeframe Coordination[/b> supporting different period configurations for various trading styles and market analysis approaches
✅ Key Takeaways
Innovative momentum-RSI implementation applying oscillator analysis to momentum values for enhanced market acceleration detection
Dual-display system enabling seamless switching between momentum visualization and smoothed RSI analysis for flexible market assessment
Advanced multi-method smoothing supporting nine different moving averages with VIDYA volatility adaptation for optimal signal quality
Conditional visualization framework with mode-specific reference lines and context-appropriate threshold displays for clean analysis
Mathematical precision implementation using proper momentum calculation and RSI formulation with comprehensive error handling
Dual-smoothing comparison system enabling crossover analysis between independently configured momentum-RSI lines for enhanced signal generation
Performance-optimized design with conditional computation and efficient algorithms for real-time momentum oscillator analysis without performance impact
Script protégé
Ce script est publié en source fermée. Toutefois, vous pouvez l'utiliser librement et sans aucune restriction - en savoir plus ici.
Clause de non-responsabilité
Les informations et les publications ne sont pas destinées à être, et ne constituent pas, des conseils ou des recommandations en matière de finance, d'investissement, de trading ou d'autres types de conseils fournis ou approuvés par TradingView. Pour en savoir plus, consultez les Conditions d'utilisation.