OPEN-SOURCE SCRIPT
Mis à jour lefrog_Price Range Waveform

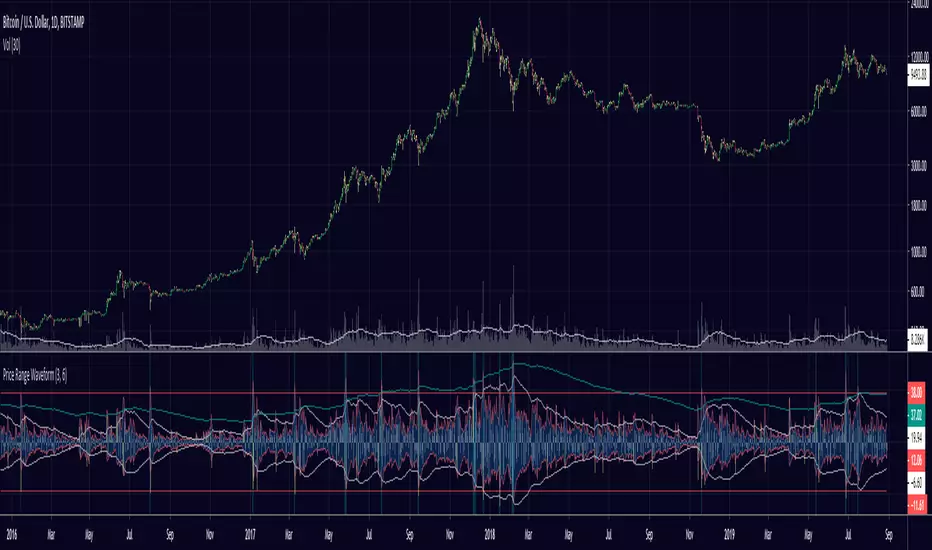
The Price Range Waveform calculated the difference from the open to close in percentage based.
The "Critical Range" input field lets you calibrate the zone above which a background color will be triggered.
Very useful in evaluating price expansion/contraction cycles and probable bottoms.
Works on any ticker and any timeframe.
Modification of the "Critical Range" default value may be mandatory.
Notes de version
- Screenshot updatedNotes de version
- Added a slower MA. Helps in spotting wider cycles- Code cleanup. Improved readability
Notes de version
- Modified ThumbnailNotes de version
New in v1.6- Core calculation has been rewritten
- Bottom side of the waveform is now more relevant
- Added the ability to disable the signals from the property menu
Script open-source
Dans l'esprit TradingView, le créateur de ce script l'a rendu open source afin que les traders puissent examiner et vérifier ses fonctionnalités. Bravo à l'auteur! Bien que vous puissiez l'utiliser gratuitement, n'oubliez pas que la republication du code est soumise à nos Règles.
Clause de non-responsabilité
Les informations et publications ne sont pas destinées à être, et ne constituent pas, des conseils ou recommandations financiers, d'investissement, de trading ou autres fournis ou approuvés par TradingView. Pour en savoir plus, consultez les Conditions d'utilisation.