PROTECTED SOURCE SCRIPT
Mis à jour True Range(TR) + Average True Range (ATR) COMBINED
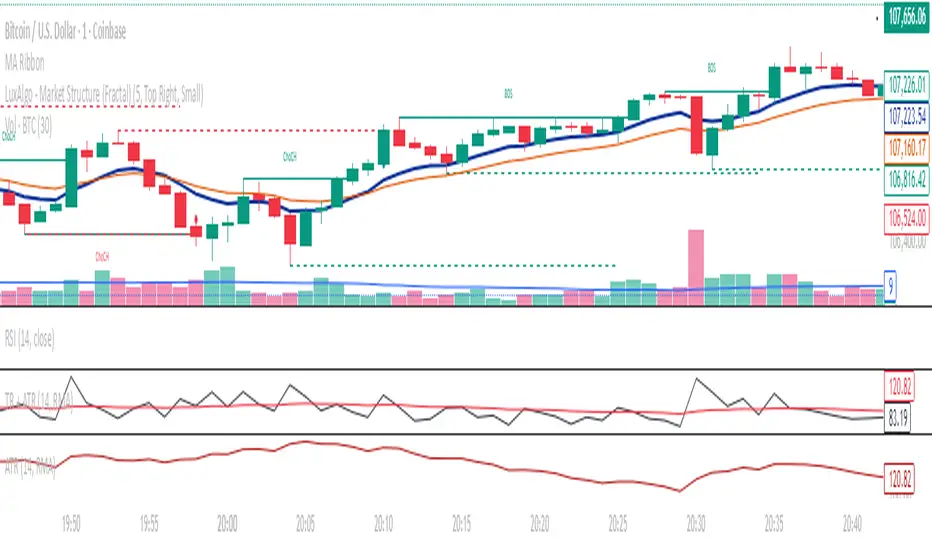
This indicator combines True Range (TR) and Average True Range (ATR) into a single panel for a clearer understanding of price volatility.
True Range (TR) measures the absolute price movement between highs, lows, and previous closes — showing raw, unsmoothed volatility.
Average True Range (ATR) is a moving average of the True Range, providing a smoother, more stable volatility signal.
📊 Usage Tips:
High TR/ATR values indicate strong price movement or volatility expansion.
Low values suggest compression or a potential volatility breakout zone.
Can be used for stop-loss placement, volatility filters, or trend strength confirmation.
⚙️ Features:
Multiple smoothing methods: RMA, SMA, EMA, WMA.
Adjustable ATR length.
Separate colored plots for TR (yellow) and ATR (red).
Works across all timeframes and instruments.
Notes de version
This indicator combines True Range (TR) and Average True Range (ATR) into a single panel for a clearer understanding of price volatility.True Range (TR) measures the absolute price movement between highs, lows, and previous closes — showing raw, unsmoothed volatility.
Average True Range (ATR) is a moving average of the True Range, providing a smoother, more stable volatility signal.
📊 Usage Tips:
High TR/ATR values indicate strong price movement or volatility expansion.
Low values suggest compression or a potential volatility breakout zone.
Can be used for stop-loss placement, volatility filters, or trend strength confirmation.
⚙️ Features:
Multiple smoothing methods: RMA, SMA, EMA, WMA.
Adjustable ATR length.
Separate colored plots for TR (yellow) and ATR (red).
Works across all timeframes and instruments.
Script protégé
Ce script est publié en source fermée. Cependant, vous pouvez l'utiliser librement et sans aucune restriction – pour en savoir plus, cliquez ici.
Clause de non-responsabilité
Les informations et publications ne sont pas destinées à être, et ne constituent pas, des conseils ou recommandations financiers, d'investissement, de trading ou autres fournis ou approuvés par TradingView. Pour en savoir plus, consultez les Conditions d'utilisation.