OPEN-SOURCE SCRIPT
Mis à jour Manipulation Day [Alex Ko]
🇺🇸 Description
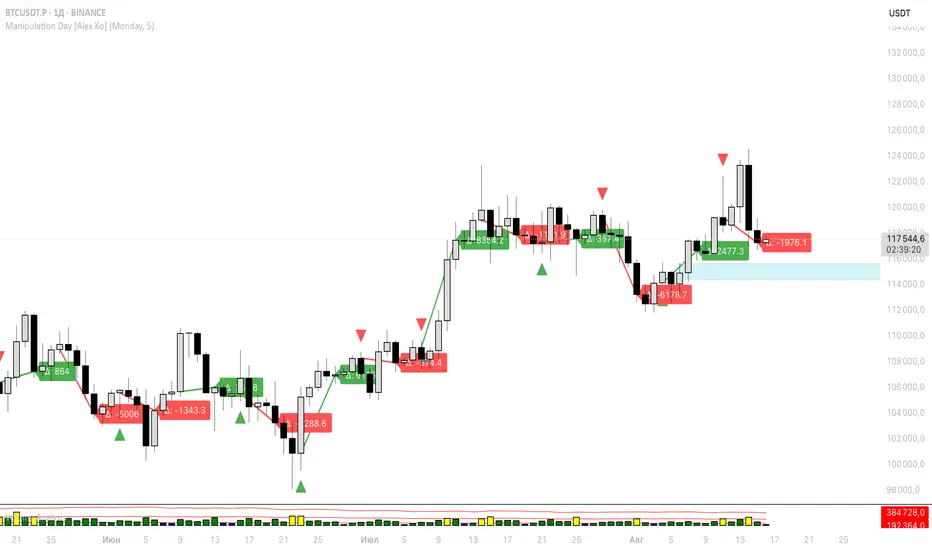
Indicator “Manipulation Day”
This indicator helps you detect a potential manipulation day (e.g. Monday) and track the price reaction afterward.
📌 Features:
Select any weekday as a manipulation day.
Wait for N candles after it.
If the manipulation day closes higher than it opened — a green triangle appears. If lower — red triangle.
After N days, a line is drawn from the next day's open to the close — green if price increased, red if dropped.
A label shows the delta (Δ) between open and close for that range.
🧠 Useful for spotting potential trap setups or liquidity grabs followed by directional moves.
Notes de version
This indicator helps you detect a potential manipulation day (e.g. Monday) and track the price reaction afterward.📌 Features:
Select any weekday as a manipulation day.
Wait for N candles after it.
If the manipulation day closes higher than it opened — a green triangle appears. If lower — red triangle.
After N days, a line is drawn from the next day's open to the close — green if price increased, red if dropped.
A label shows the delta (Δ) between open and close for that range.
🧠 Useful for spotting potential trap setups or liquidity grabs followed by directional moves.
Notes de version
upd vsaScript open-source
Dans l'esprit de TradingView, le créateur de ce script l'a rendu open-source, afin que les traders puissent examiner et vérifier sa fonctionnalité. Bravo à l'auteur! Vous pouvez l'utiliser gratuitement, mais n'oubliez pas que la republication du code est soumise à nos Règles.
Clause de non-responsabilité
Les informations et les publications ne sont pas destinées à être, et ne constituent pas, des conseils ou des recommandations en matière de finance, d'investissement, de trading ou d'autres types de conseils fournis ou approuvés par TradingView. Pour en savoir plus, consultez les Conditions d'utilisation.
Script open-source
Dans l'esprit de TradingView, le créateur de ce script l'a rendu open-source, afin que les traders puissent examiner et vérifier sa fonctionnalité. Bravo à l'auteur! Vous pouvez l'utiliser gratuitement, mais n'oubliez pas que la republication du code est soumise à nos Règles.
Clause de non-responsabilité
Les informations et les publications ne sont pas destinées à être, et ne constituent pas, des conseils ou des recommandations en matière de finance, d'investissement, de trading ou d'autres types de conseils fournis ou approuvés par TradingView. Pour en savoir plus, consultez les Conditions d'utilisation.