OPEN-SOURCE SCRIPT
EMAs 20/50/200 with Trend Coloring

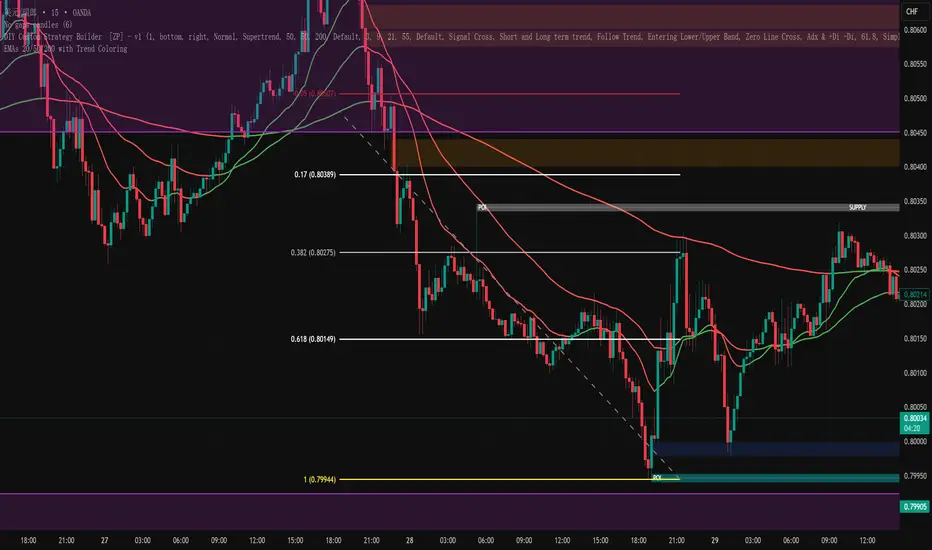
It calculates EMA 20, 50, and 200.
For each EMA, it compares the current value with the previous bar (ema > ema[1]).
If rising → green, if falling → red.
All three EMAs are plotted with different colors dynamically changing by slope.
For each EMA, it compares the current value with the previous bar (ema > ema[1]).
If rising → green, if falling → red.
All three EMAs are plotted with different colors dynamically changing by slope.
Script open-source
Dans l'esprit TradingView, le créateur de ce script l'a rendu open source afin que les traders puissent examiner et vérifier ses fonctionnalités. Bravo à l'auteur! Bien que vous puissiez l'utiliser gratuitement, n'oubliez pas que la republication du code est soumise à nos Règles.
Clause de non-responsabilité
Les informations et publications ne sont pas destinées à être, et ne constituent pas, des conseils ou recommandations financiers, d'investissement, de trading ou autres fournis ou approuvés par TradingView. Pour en savoir plus, consultez les Conditions d'utilisation.