PROTECTED SOURCE SCRIPT
Mis à jour Equal Highs/Lows

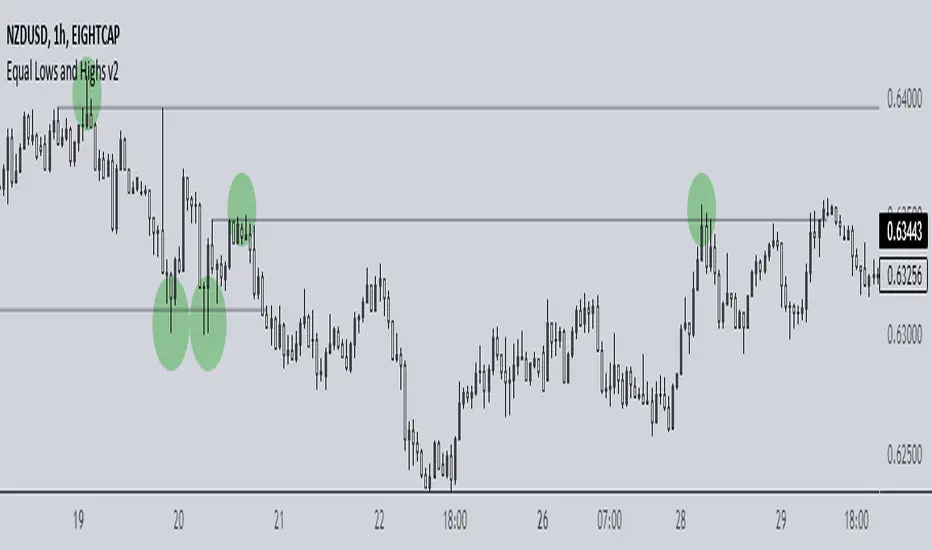
This indicator checks for equal highs/lows using the previous three pivots at any given time. This is helpful for identifying where liquidity lies and where a likely sweep/SFP may occur.
You can choose the bar size for the pivots to check for in order to detect desirable levels as well as adjust the acceptable deviation for near-equal highs/lows.
By default, the settings are ideal for BTC in the 5-15m charts. Deviation would need to be set in the decimals for lower-priced symbols and experimentation is recommended.
Notes de version
- Updated script to avoid redrawing levels- Replaced "tracking" with labels
- Added option to check for equal highs/lows on consecutive candles
Notes de version
Added ability to change eqh/l colorsNotes de version
This script has been completely redone to reduce complexity. Now checks for equal highs/low, plots, and removes them if future prices exceed them.Notes de version
Added symbol to eqh/ls to represent liquidityNotes de version
This indicator should now work with all symbols - feel free to provide feedback if there are any issuesNotes de version
- Reduced number of lines (previously 500 and now 15)- Added option to adjust sensitivity on equal highs/lows
Notes de version
Added alertsNotes de version
- Added tooltip for indicator sensitivity input- Removed liquidity label/text color from inputs
Notes de version
Added input for max linesNotes de version
- Updated input grouping- Added alerts options if you exclusively want equal highs or lows
Notes de version
Shows equal highs and lows which usually indicates a large amount of liquidity beyond them. This information can guide decisions when price sweeps these areas then reverses direction (SFPs). In addition, these areas may indicate a potential break up/down as price fails to hold beneath/above.Improvements include:
- New codebase to detect equal lows/highs
- Shows historical areas for easier backtesting
- Granular input for sensitivity based on timeframe
Notes de version
Added the option for symbols in addition to the usual lines Script protégé
Ce script est publié en source fermée. Cependant, vous pouvez l'utiliser librement et sans aucune restriction – pour en savoir plus, cliquez ici.
Clause de non-responsabilité
Les informations et publications ne sont pas destinées à être, et ne constituent pas, des conseils ou recommandations financiers, d'investissement, de trading ou autres fournis ou approuvés par TradingView. Pour en savoir plus, consultez les Conditions d'utilisation.
Script protégé
Ce script est publié en source fermée. Cependant, vous pouvez l'utiliser librement et sans aucune restriction – pour en savoir plus, cliquez ici.
Clause de non-responsabilité
Les informations et publications ne sont pas destinées à être, et ne constituent pas, des conseils ou recommandations financiers, d'investissement, de trading ou autres fournis ou approuvés par TradingView. Pour en savoir plus, consultez les Conditions d'utilisation.