PROTECTED SOURCE SCRIPT
顶/底分型 指标
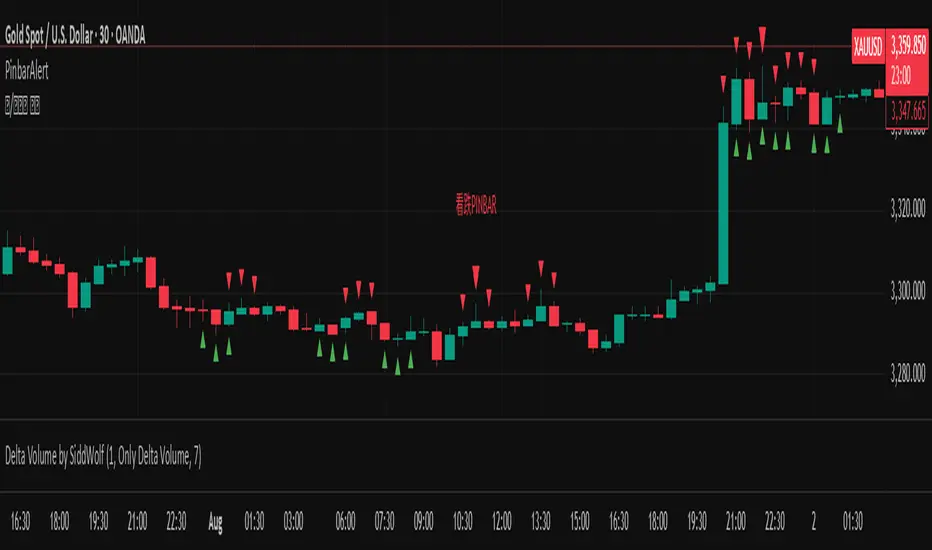
Top/Bottom Fractal Indicator is a technical analysis tool used to identify potential reversal points in a market trend. It is based on the concept of fractal patterns, which consist of specific candlestick formations that signal local highs (top fractals) or lows (bottom fractals).
A top fractal typically occurs when the high of a middle candlestick is higher than the highs of the two candles on either side. This formation suggests that upward momentum may be weakening and a downward reversal could follow. Conversely, a bottom fractal forms when the low of a middle candlestick is lower than the lows of the two adjacent candles, indicating a potential shift from a downtrend to an uptrend.
This indicator is commonly used to spot market turning points, determine entry or exit signals, and enhance the reliability of other indicators such as Bollinger Bands or MACD. Because of its clear structure and reliable reversal signals, the Top/Bottom Fractal Indicator is also widely applied in wave theory and price action strategies.
Script protégé
Ce script est publié en source fermée. Cependant, vous pouvez l'utiliser librement et sans aucune restriction – pour en savoir plus, cliquez ici.
Clause de non-responsabilité
Les informations et publications ne sont pas destinées à être, et ne constituent pas, des conseils ou recommandations financiers, d'investissement, de trading ou autres fournis ou approuvés par TradingView. Pour en savoir plus, consultez les Conditions d'utilisation.