OPEN-SOURCE SCRIPT
Mis à jour Price–Volume Anomaly Detector

Description
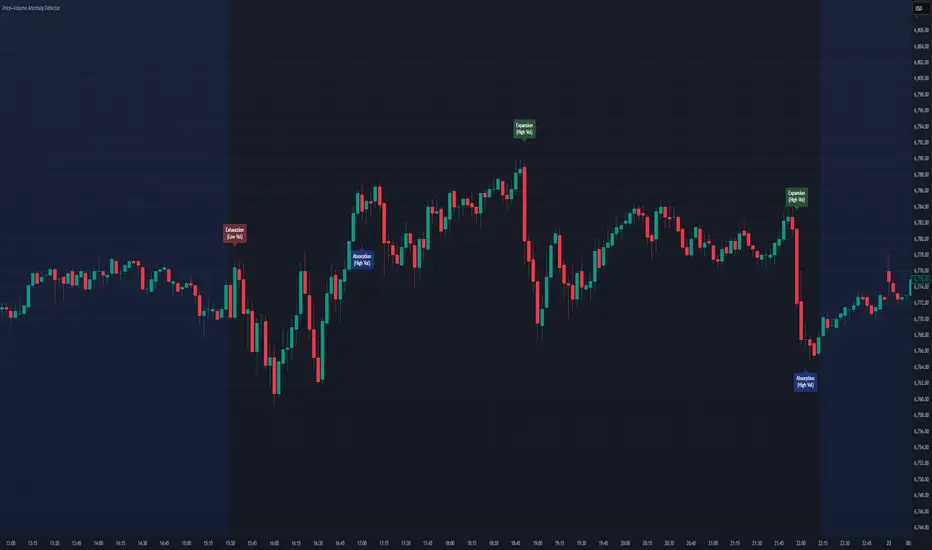
This indicator identifies unusual relationships between price strength and trading volume. By analyzing expected intraday volume behavior and comparing it with current activity, it highlights potential exhaustion, absorption, or expansion events that may signal changing market dynamics.
How It Works
The script profiles average volume by time of day and compares current volume against this adaptive baseline. Combined with normalized price movement (ATR-based), it detects conditions where price and volume diverge:
Key Features
Inputs Overview
How to Use:
How It Helps
⚠️Disclaimer:
This script is provided for educational and informational purposes only. It is not financial advice and should not be considered a recommendation to buy, sell, or hold any financial instrument. Trading involves significant risk of loss and is not suitable for every investor. Users should perform their own due diligence and consult with a licensed financial advisor before making any trading decisions. The author does not guarantee any profits or results from using this script, and assumes no liability for any losses incurred. Use this script at your own risk.
This indicator identifies unusual relationships between price strength and trading volume. By analyzing expected intraday volume behavior and comparing it with current activity, it highlights potential exhaustion, absorption, or expansion events that may signal changing market dynamics.
How It Works
The script profiles average volume by time of day and compares current volume against this adaptive baseline. Combined with normalized price movement (ATR-based), it detects conditions where price and volume diverge:
- Exhaustion: Strong price move on low volume (potential fade)
- Absorption: Weak price move on high volume (potential reversal)
- Expansion: Strong price move on high volume (momentum continuation)
Key Features
- Adaptive time-based volume normalization
- Configurable sensitivity thresholds
- Optional visibility for each anomaly type
- Adjustable label transparency and offset
- Light Mode support: label text automatically adjusts for dark or light chart backgrounds
- Lightweight overlay design
Inputs Overview
- Volume Profile Resolution: Defines time bucket size for expected volume
[*]Lookback Days: Controls how quickly the profile adapts - Price / Volume Thresholds: Tune anomaly sensitivity
- Show Expansion / Exhaustion / Absorption: Toggle specific labels
- Label Transparency & Offset: Adjust chart visibility
How to Use:
- Apply the indicator to any chart or timeframe.
- Observe where labels appear:
🔴 Exhaustion: strong price, weak volume
🔵 Absorption: weak price, strong volume
🟢 Expansion: strong price, strong volume - Use these as context clues, not trade signals — combine with broader volume or trend analysis.
How It Helps
- Reveals hidden price–volume imbalances
- Highlights areas where momentum may be fading or strengthening
- Enhances understanding of market behavior beyond raw price action
⚠️Disclaimer:
This script is provided for educational and informational purposes only. It is not financial advice and should not be considered a recommendation to buy, sell, or hold any financial instrument. Trading involves significant risk of loss and is not suitable for every investor. Users should perform their own due diligence and consult with a licensed financial advisor before making any trading decisions. The author does not guarantee any profits or results from using this script, and assumes no liability for any losses incurred. Use this script at your own risk.
Notes de version
📢 Update: Alerts Added!This update introduces smart alert conditions so you can receive real-time notifications when key price–volume anomalies occur.
✅ What’s New
Alert conditions added for:
• Exhaustion (Strong move + Low Volume)
• Absorption (Weak move + High Volume)
• Expansion (Strong move + High Volume)
• Any anomaly (combined alert)
You can now set alerts to get notified when potential reversals, absorption signals, or momentum confirmation events happen — without needing to monitor the chart constantly.
Script open-source
Dans l'esprit TradingView, le créateur de ce script l'a rendu open source afin que les traders puissent examiner et vérifier ses fonctionnalités. Bravo à l'auteur! Bien que vous puissiez l'utiliser gratuitement, n'oubliez pas que la republication du code est soumise à nos Règles.
Clause de non-responsabilité
Les informations et publications ne sont pas destinées à être, et ne constituent pas, des conseils ou recommandations financiers, d'investissement, de trading ou autres fournis ou approuvés par TradingView. Pour en savoir plus, consultez les Conditions d'utilisation.