OPEN-SOURCE SCRIPT
Mis à jour WaveMacBoll
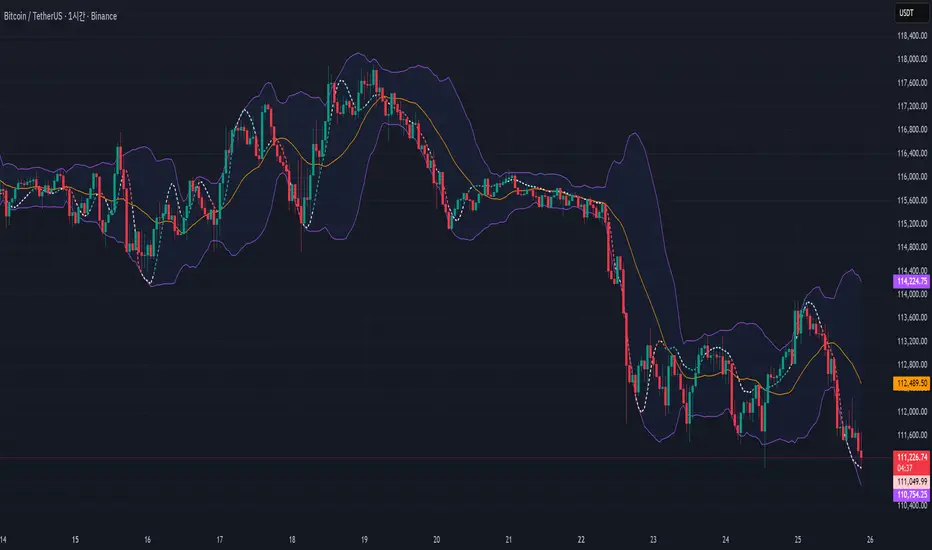
I wanted to see the two indicators in the candle chart, not in a separate window. And within the Bollinger band, it seemed to put it fine.
Important Note on Line Styles
Due to TradingView's multi-timeframe environment restrictions (timeframe = '', timeframe_gaps = true), I couldn't implement dotted or dashed line styles programmatically. The indicator uses solid lines by default.
If you prefer dotted/dashed lines for better visual distinction:
Add the indicator to your chart
Click on the indicator settings (gear icon)
Go to "Style" tab
Manually change line styles for each plot
Unfortunately, PineScript doesn't support line.new() or similar drawing functions in multi-timeframe mode, limiting our styling options to basic plot styles.
If you know a good solution for implementing dotted/dashed lines in multi-timeframe indicators without using drawing objects, please share it in the comments! I'd love to improve this aspect of the indicator
Notes de version
.Script open-source
Dans l'esprit TradingView, le créateur de ce script l'a rendu open source afin que les traders puissent examiner et vérifier ses fonctionnalités. Bravo à l'auteur! Bien que vous puissiez l'utiliser gratuitement, n'oubliez pas que la republication du code est soumise à nos Règles.
Clause de non-responsabilité
Les informations et publications ne sont pas destinées à être, et ne constituent pas, des conseils ou recommandations financiers, d'investissement, de trading ou autres fournis ou approuvés par TradingView. Pour en savoir plus, consultez les Conditions d'utilisation.
Script open-source
Dans l'esprit TradingView, le créateur de ce script l'a rendu open source afin que les traders puissent examiner et vérifier ses fonctionnalités. Bravo à l'auteur! Bien que vous puissiez l'utiliser gratuitement, n'oubliez pas que la republication du code est soumise à nos Règles.
Clause de non-responsabilité
Les informations et publications ne sont pas destinées à être, et ne constituent pas, des conseils ou recommandations financiers, d'investissement, de trading ou autres fournis ou approuvés par TradingView. Pour en savoir plus, consultez les Conditions d'utilisation.