OPEN-SOURCE SCRIPT
Hancock - Floating O/B O/S IFT RSI T3MA
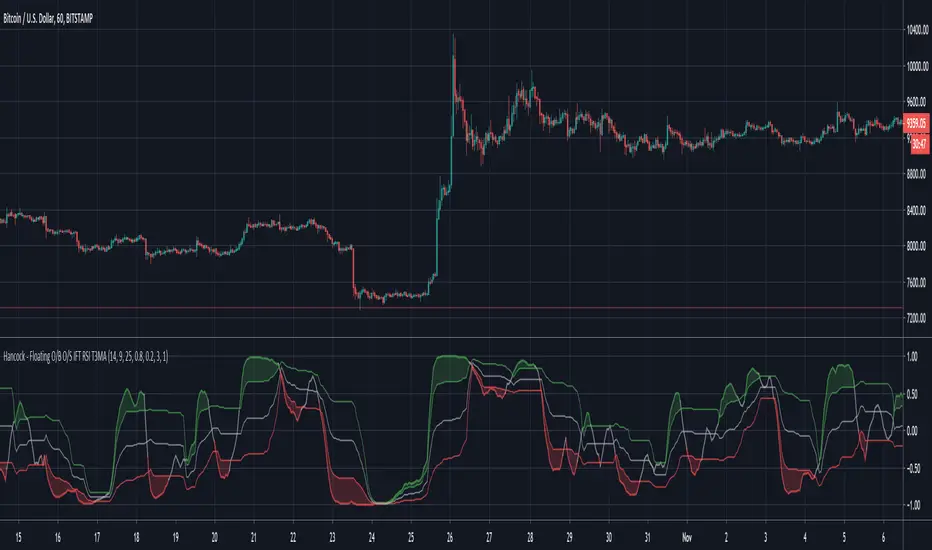
This is a version of the Inverse Fisher Transform Relative Strength Index with floating oversold and overbought thresholds.
Configurable parameters:
RSI length - This is the period used for the RSI .
RSI Smooth Length - This is the smoothing period of the Weighted Moving Average used for the smoothing in Inverse Fisher Transform .
RSI Threshold Period - This is the period used for calculating the floating oversold and overbought thresholds.
RSI Overbought - Configures the overbought threshold (80% default).
RSI Oversold - Configures the oversold threshold (20% default).
T3 Smoothing - Enabling this applies T3MA smoothing to the RSI.
T3 Length - This is the period used for the T3MA smoothing of the RSI.
T3 Factor - This is the factor used for the T3MA smoothing of the RSI.
RSI line breaching the thresholds are clearly indicated by filled chart plots.
An inverse Fisher transform of RSI is designed to enhance the extremes (overbought and oversold zones), in combination with floating thresholds this version allows faster and cleaner trend detection and identification. With additional smoothing, false signals can be avoided. As with any other indicator some experimenting with parameters is advised (in order to find optimal settings for symbol/time frame pair).
Happy trading folks!
Hancock
Script open-source
Dans l'esprit TradingView, le créateur de ce script l'a rendu open source afin que les traders puissent examiner et vérifier ses fonctionnalités. Bravo à l'auteur! Bien que vous puissiez l'utiliser gratuitement, n'oubliez pas que la republication du code est soumise à nos Règles.
Clause de non-responsabilité
Les informations et publications ne sont pas destinées à être, et ne constituent pas, des conseils ou recommandations financiers, d'investissement, de trading ou autres fournis ou approuvés par TradingView. Pour en savoir plus, consultez les Conditions d'utilisation.