OPEN-SOURCE SCRIPT
Mis à jour Buy/Sell Alert EMA with SuperFormula by zdmre
*** Use it at your own risk
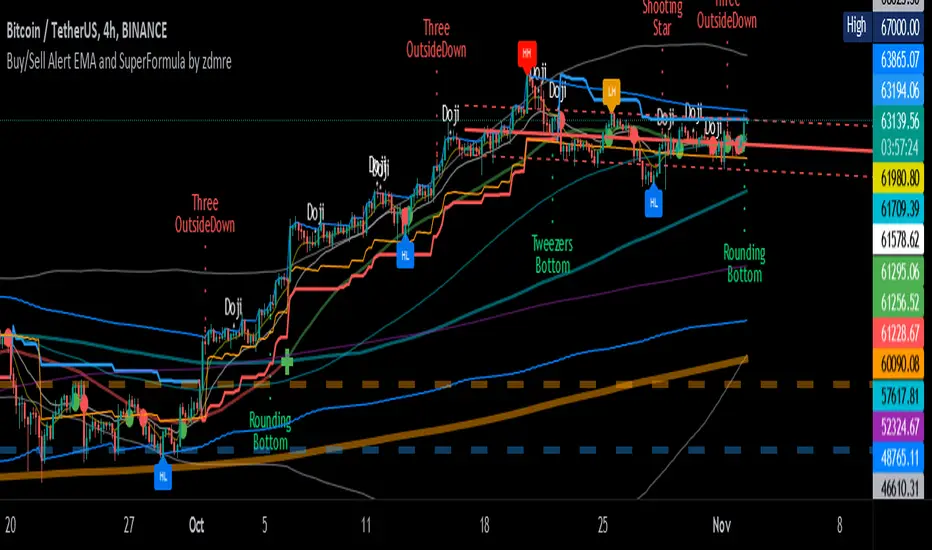
This indicator has 3 indicators and gives a buy/sell signal depending on the EMA.
3 indicators:
It also shows the value on the candle as a warning in the Buy and Sell signals. This value is calculated with a special formula I have created.
On the other hand Bollinger Band and Ichimoku Cloud are also included to check the accuracy of the signals.
For this indicator, I recommend a minimum of 4 hours chart.
This indicator has 3 indicators and gives a buy/sell signal depending on the EMA.
3 indicators:
- - Ichimoku
- - Bollinger Band
- - EMA
It also shows the value on the candle as a warning in the Buy and Sell signals. This value is calculated with a special formula I have created.
On the other hand Bollinger Band and Ichimoku Cloud are also included to check the accuracy of the signals.
For this indicator, I recommend a minimum of 4 hours chart.
Notes de version
v 2.0-adding THEIL-SEN ESTIMATOR @tbiktag (Thanks my friend)
-changing default EMA values to 8-20
Notes de version
Release Notes: v 3.0-Adding Bitcoin Investor Tool: 2-Year MA Multiplier + 1-Year MA
-Adding Pi Cycle Top Indicator
Notes de version
Release Notes: Release Notes: v 4.0-Adding KAMA Indicator
-Adding Cup Indicator
Notes de version
Max bar problem fixed.Trailing Stop Loss improved.
"Show Buy/Sell Signals" added. Default value=true
"Show Calculation Values" added. Default value=false
Notes de version
Improved RSI, Sell Point, Calc Value Label.Added "Show TrailingSTOP Prices" label.
Notes de version
Updated PineScript version 5Added Pattern Trend Calculations (Fibonacci, RSI, DMI)
Added Flagging
Added ZigZag (HH-HL-LH-LL)
Added Tables
Added Advanced Patterns
and more
Notes de version
Removed KAMA,Removed Cup,
Removed Pattern Trend Calculations (Fibonacci, RSI, DMI)
Removed Tables,
Added Advanced Patterns
Added Cup and Handle.
Optimization and Visual improvements.
Notes de version
Bug fixes.Script open-source
Dans l'esprit TradingView, le créateur de ce script l'a rendu open source afin que les traders puissent examiner et vérifier ses fonctionnalités. Bravo à l'auteur! Bien que vous puissiez l'utiliser gratuitement, n'oubliez pas que la republication du code est soumise à nos Règles.
Clause de non-responsabilité
Les informations et publications ne sont pas destinées à être, et ne constituent pas, des conseils ou recommandations financiers, d'investissement, de trading ou autres fournis ou approuvés par TradingView. Pour en savoir plus, consultez les Conditions d'utilisation.
Script open-source
Dans l'esprit TradingView, le créateur de ce script l'a rendu open source afin que les traders puissent examiner et vérifier ses fonctionnalités. Bravo à l'auteur! Bien que vous puissiez l'utiliser gratuitement, n'oubliez pas que la republication du code est soumise à nos Règles.
Clause de non-responsabilité
Les informations et publications ne sont pas destinées à être, et ne constituent pas, des conseils ou recommandations financiers, d'investissement, de trading ou autres fournis ou approuvés par TradingView. Pour en savoir plus, consultez les Conditions d'utilisation.