OPEN-SOURCE SCRIPT
Mis à jour Timebender 369 Time Calculator
Overview
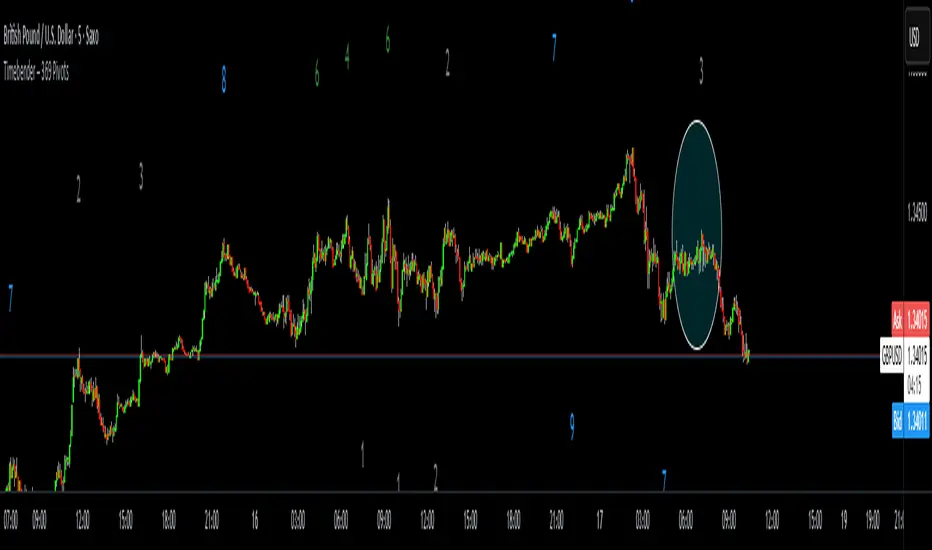
The Timebender Digits indicator visualizes rhythmic price cycles by marking confirmed swing highs and lows with dynamically colored numerical stamps.
Each number is derived from the sum of the current candle’s hour and minute, reduced to a single digit (1–9), providing a visual “time signature” for each structural turn in market flow.
This is a structural-pivot model inspired by LuxAlgo’s swing logic, rebuilt from the ground up in Pine v6 using the Timebender Rulebook framework for flawless compilation and precision label anchoring.
Core Features
Dynamic Swing Detection:
Detects structural highs/lows using ta.pivothigh() and ta.pivotlow(), confirmed after the selected number of bars (len).
Digit Logic (1–9):
Converts the pivot candle’s timestamp into a reduced digit from 1–9, acting as a symbolic rhythm marker.
Phase-Based Coloring:
1-3 → Accumulation (Gray)
4-6 → Manipulation (Green)
7-9 → Distribution (Blue)
Floating or Fixed Labels:
Option to keep digits visually anchored above/below candles (yloc.abovebar/belowbar) or locked to price (yloc.price) with customizable ATR offset.
Clean Visuals:
Transparent background, no boxes, no tooltips — just crisp digits that scale smoothly with zoom.
Master Toggle:
Instantly hide/show all digits without removing the indicator.
Inputs & Customization
Show Digits on Chart: Enable/disable plotting.
Pivot Length: Number of bars used to confirm swings (default 21).
Float Above/Below Bars: Switch between floating or price-anchored mode.
ATR Offset Multiplier: Adjust spacing when price-anchored.
Digit Size: Tiny → Huge (default Large).
Color Controls: Customize the Accumulation, Manipulation, and Distribution color palette.
Use Cases
Visualize time-based rhythm in market structure.
Identify cyclical energy between accumulation, manipulation, and distribution phases.
Study how market timing aligns with structural swing formation.
Notes de version
We just changed the name thats shown, simple and clearer. Notes de version
Name change, to appear more cleanScript open-source
Dans l'esprit de TradingView, le créateur de ce script l'a rendu open-source, afin que les traders puissent examiner et vérifier sa fonctionnalité. Bravo à l'auteur! Vous pouvez l'utiliser gratuitement, mais n'oubliez pas que la republication du code est soumise à nos Règles.
once you see what is possible, how can you do otherwise?
Clause de non-responsabilité
Les informations et les publications ne sont pas destinées à être, et ne constituent pas, des conseils ou des recommandations en matière de finance, d'investissement, de trading ou d'autres types de conseils fournis ou approuvés par TradingView. Pour en savoir plus, consultez les Conditions d'utilisation.
Script open-source
Dans l'esprit de TradingView, le créateur de ce script l'a rendu open-source, afin que les traders puissent examiner et vérifier sa fonctionnalité. Bravo à l'auteur! Vous pouvez l'utiliser gratuitement, mais n'oubliez pas que la republication du code est soumise à nos Règles.
once you see what is possible, how can you do otherwise?
Clause de non-responsabilité
Les informations et les publications ne sont pas destinées à être, et ne constituent pas, des conseils ou des recommandations en matière de finance, d'investissement, de trading ou d'autres types de conseils fournis ou approuvés par TradingView. Pour en savoir plus, consultez les Conditions d'utilisation.